Filter Bar
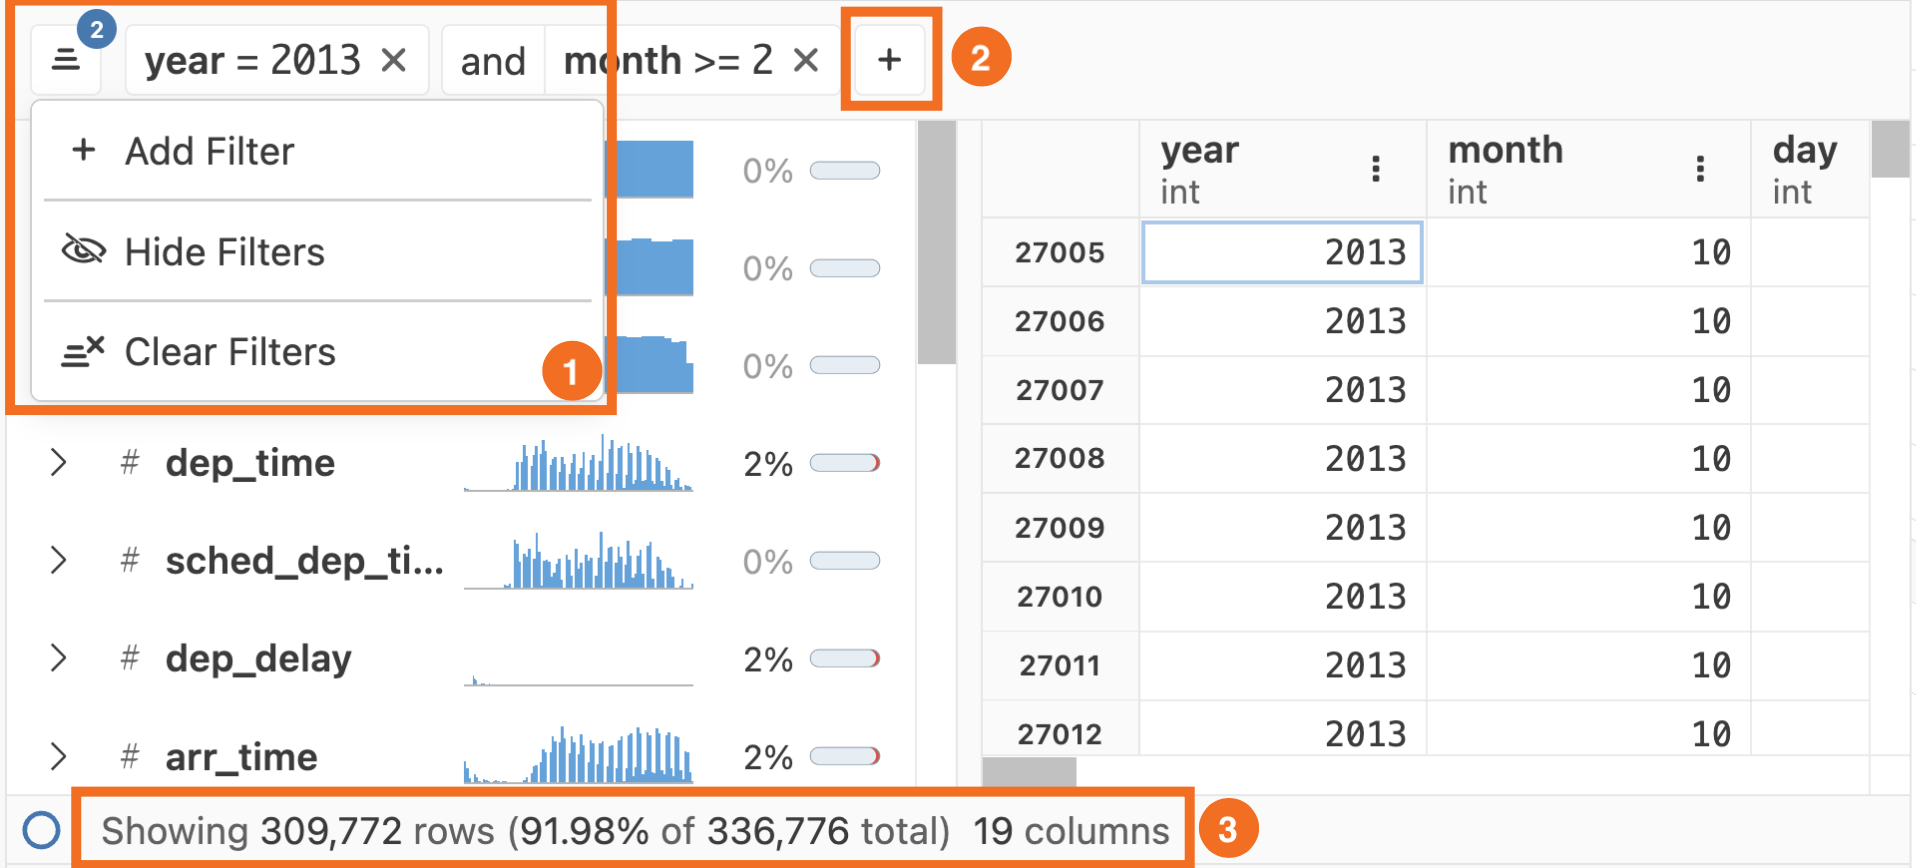
The filter bar provides controls to:
- Add Filter: Create new filters for your data
- Show/Hide Filters: Toggle filter visibility
- Clear Filters: Remove all applied filters
- Convert to Code: Generate reusable code from your current filters
The status bar at the bottom displays the percentage and number of remaining rows after you apply filters for the main data grid.
Add filters
To create a new filter:
- Select Add Filter from the Manage Filter dropdown or the button in the filter bar
- Select a column from the list
- Choose from the available filter options for that column type
- Configure the filter parameters
You can also create filters directly from the data grid by right-clicking a column and selecting Add Filter from the context menu. This method pre-populates the column name.
Filter types by column
Some filters apply to all column types, such as checking for equality, null, or missing values. Available filters also depend on the specific column data type. Here are examples for common column type filters:
String columns:
- Contains
- Starts with or ends with
- Is empty
- Equal to
Numeric columns:
- Less than or greater than
- Equal to
- Between two values (inclusive)
For sorting capabilities, see the Data Grid documentation.
Show or hide filters
To toggle filter visibility, select Show Filters or Hide Filters from the Manage Filter dropdown.
When filters are hidden, the data remains filtered. Only the filter controls are hidden from view. Hiding filters provides more screen space to view your data.
Clear filters
To remove all applied filters, select Clear Filters from the Manage Filter dropdown. All filters are removed and the data returns to its original state. You can remove individual filters by clicking the button on each filter control.
Convert to code
The Data Explorer includes a Convert to Code button in the top action bar. This button writes Python or R code that reproduces your current data view, including any filters or sorts you’ve applied during exploration. This allows you to quickly capture your interactive exploration as reproducible code. To convert your Data Explorer view to code:
- Apply any filters, sorts, or other transformations in the Data Explorer
- Select the Convert to Code button in the top action bar
- Preview the code in the modal
- Select Copy to Clipboard to copy the code for pasting into the console, a script, or any other location
The code references the dataframe object already loaded in your session rather than reading data from disk. The Convert to Code button writes code appropriate for your dataframe type:
- pandas dataframes produce pandas code
- polars dataframes produce polars code, with the option to convert to pandas code
- R dataframes and tibbles produce dplyr code with pipe syntax
- Files opened directly (
.csv,.tsv,.parquet) produce DuckDB SQL code