Data Grid
The data grid is the primary display, with a spreadsheet-like cell-by-cell view. It’s intended to scale efficiently to relatively large in-memory datasets, up to millions of rows or columns.
Each Data Explorer instance watches the underlying data for changes, so if you edit a data file or modify an in-memory dataframe, the changes will be reflected in the Data Explorer.
Supported data frame libraries
Pandas and Polars dataframe objects are supported in Python, and data.frame, tibble, and data.table are supported in R. Previews of database connections managed by the Connections pane are also supported, for both Python and R.
Based on user feedback, we may add support for other libraries that expose a tabular data interface.
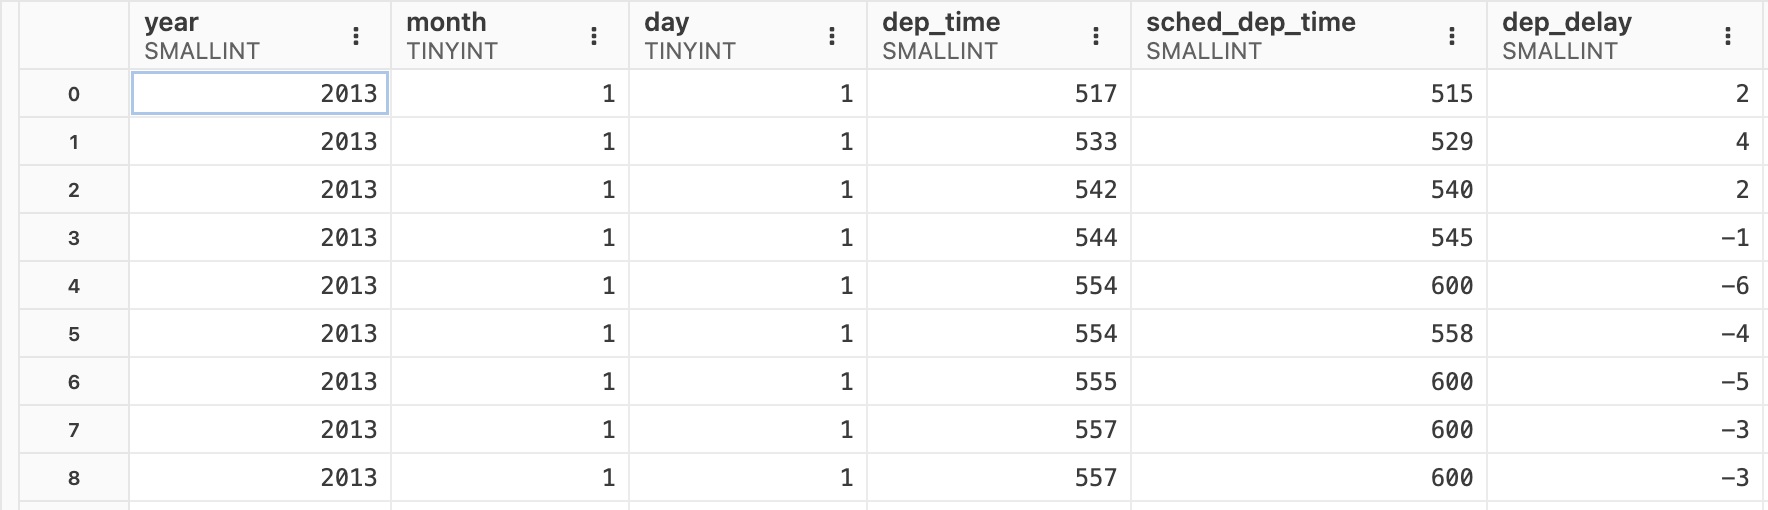
Column overview
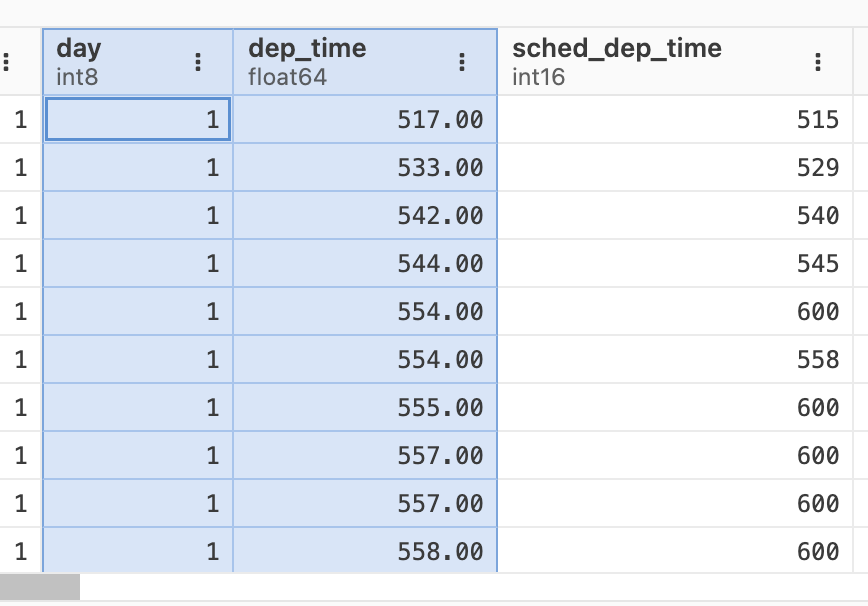
Each column header has the column name above the data type, which is dependent on the backend type (language runtime or DuckDB).
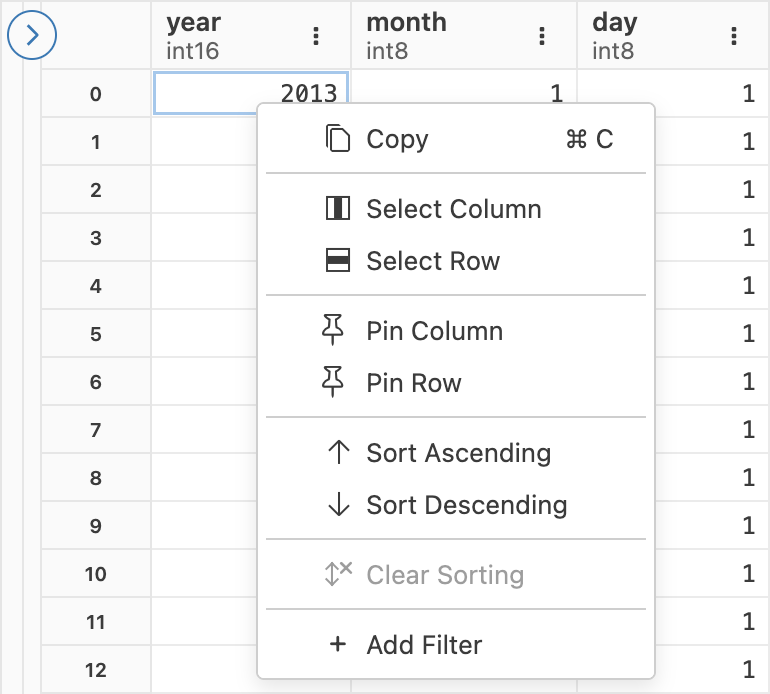
At the top right of each column, there is a context menu for column specific actions.
Columns can be resized by selecting and dragging the border on either side of a column.
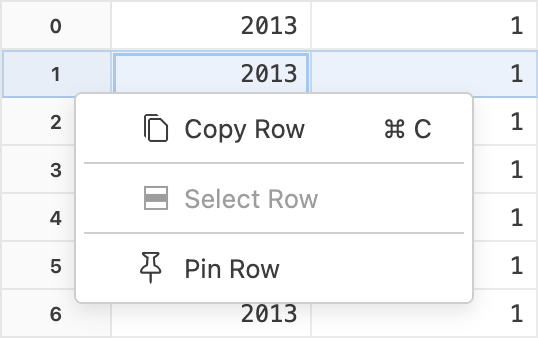
Row overview
Row labels default to the observed row index, with a zero-based index in Python and a one-based index in R. Alternatively, pandas and R users may also have rows with modified indices or string-based labels.
Right-clicking on a row header will bring up a context menu for row specific actions.
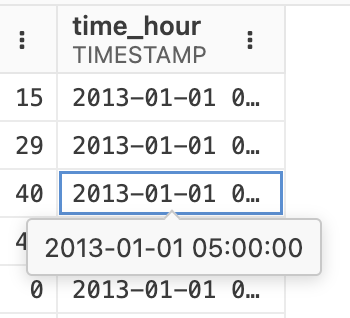
Cell overview
For long strings or other data values that do not fully fit in a grid cell, you can see a tooltip containing the complete value by hovering over the cell:
Right-clicking or pressing on a cell will bring up a context menu for cell specific actions.
When focused on a cell you can bring up the row header menu by pressing . You can bring up the column header menu by pressing
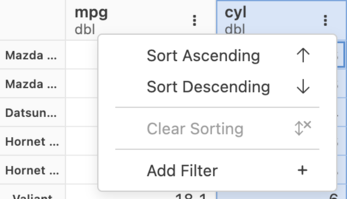
Sorting
To sort the values in a column, open a column context menu from the top of the grid and select either Sort Ascending or Sort Descending.
To clear an individual column sort, select the column header and choose Clear Sorting from the context menu.
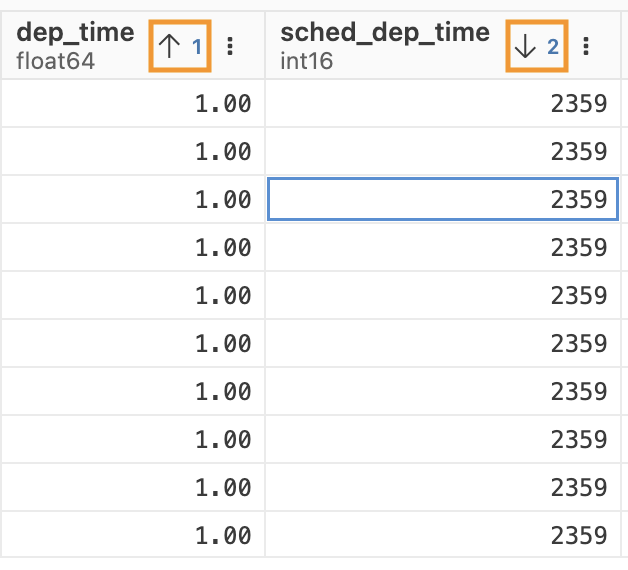
When a column is sorted, the column header displays an arrow pointing up or down to indicate the sort direction. You can sort by multiple columns by opening the context menu for a second column and sorting it as well. The number next to the sort direction indicates the sort order of the column.
To clear all sorting, select the Clear Column Sorting button in the top action bar.
Pinning columns and rows
You can pin columns and rows to keep them visible while scrolling through large datasets. Pinned columns appear on the left side of the grid, and pinned rows appear at the top.
Pin columns
To pin a column, right-click the column header and select Pin Column from the context menu. The column moves to the left side of the grid and remains visible when you scroll horizontally.
To unpin a column, right-click the pinned column header and select Unpin Column from the context menu.
Pin rows
To pin a row, right-click the row header and select Pin Row from the context menu. The row moves to the top of the grid and remains visible when you scroll vertically.
To unpin a row, right-click the pinned row header and select Unpin Row from the context menu.
Pin multiple items
You can pin multiple columns and rows. Pinned columns appear in the order you pin them, starting from the leftmost position. Pinned rows appear in the order you pin them, starting from the top.
Selection, copy, and paste
The data grid provides copy-and-paste capabilities similar to a spreadsheet. You can select:
- A single cell
- A rectangular range of cells
- One or more rows
- One or more columns
To copy a single value, select a cell and press . You can also copy the value using the right-click context menu.
To copy a rectangular range of cells, select a cell, then hold ShiftShift and select another cell to define the range. Press or use the context menu to copy the values.
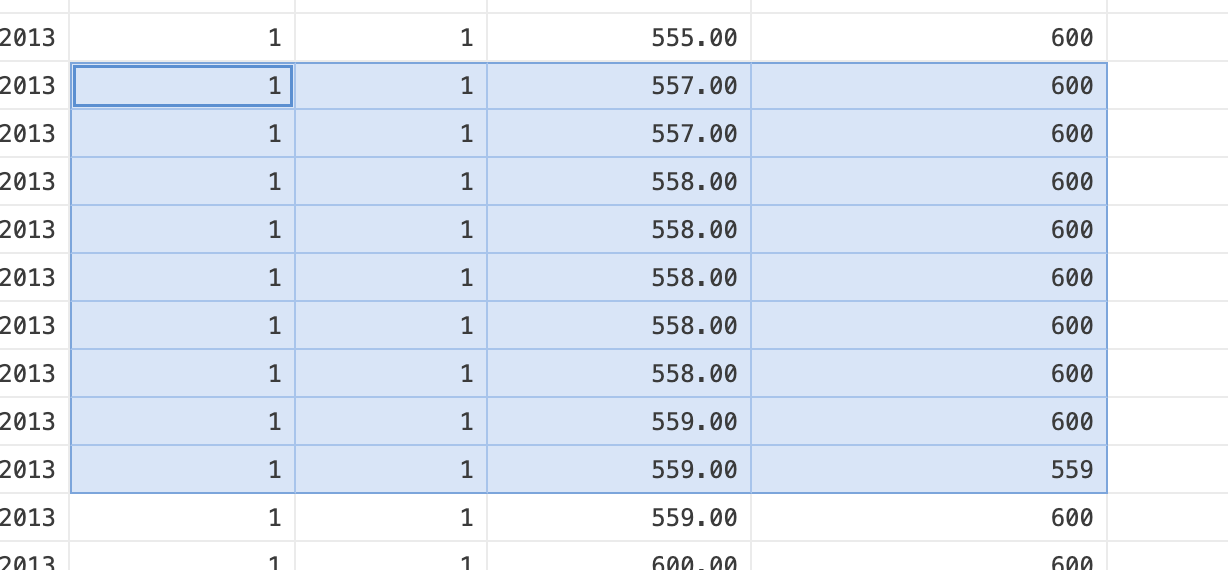
When you copy a rectangular range of cells, the system copies the values with column names in tab-separated format. This format makes pasting into Excel or Google Sheets easier.
To copy entire rows or columns, select the first row label or column label. Then either hold ShiftShift and select another row or column label to define a range, or hold and select additional labels to choose individual rows or columns.
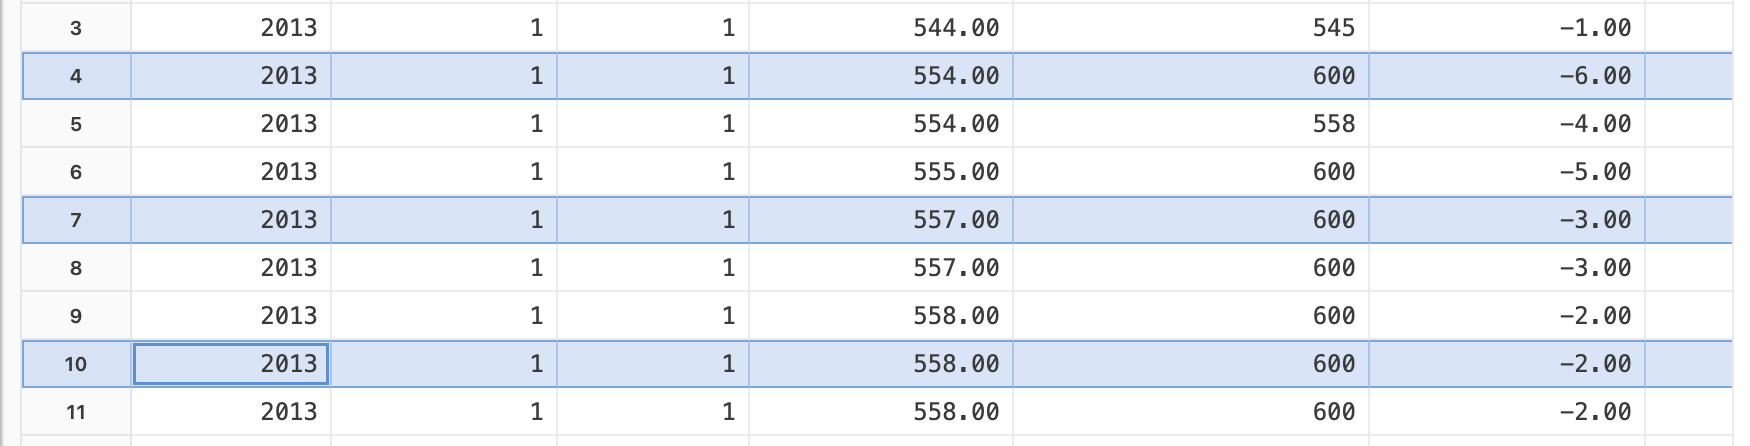
When you copy entire rows or columns, the system includes column names in the tab-separated output, similar to copying a rectangular range of cells.