Collaborate with AI on an R analysis
Is this the right tutorial to start with? It picks up where First data analysis with R in a Quarto document and Migrate to Positron from RStudio leave off. If you have not worked through those, start there. This tutorial assumes you already know how to:
- Install Positron
- Use the Command Palette
- Run a Quarto code cell
Positron is a free, source-available IDE for data science, built on the same open source core as VS Code. In the earlier tutorials, you built a Quarto document by hand. In this one, you will bring an AI assistant alongside you to write, extend, and improve an analysis, while you stay in control of the result.
You will work through a small analysis from raw data to a published dashboard, using the AI features you might rely on every day:
- Posit Assistant, the AI assistant built into Positron
- The
/reportcommand, which turns a conversation with Posit Assistant into a Quarto document - Fix and Explain buttons that troubleshoot code errors
- Code completions, which suggest the next line of code as you type
You will practice these by analyzing a new dataset: a spreadsheet of retail orders that you will aggregate into quarterly sales, visualize, and ship as an interactive dashboard.
Open the workshop project
The dataset you will use lives in a GitHub repository, alongside an renv.lock file that records the exact package versions the analysis needs.
You can clone a repository without leaving Positron. The New Folder from Git option, available on the Welcome screen or from the Command Palette, clones a remote repository and opens it as your project.
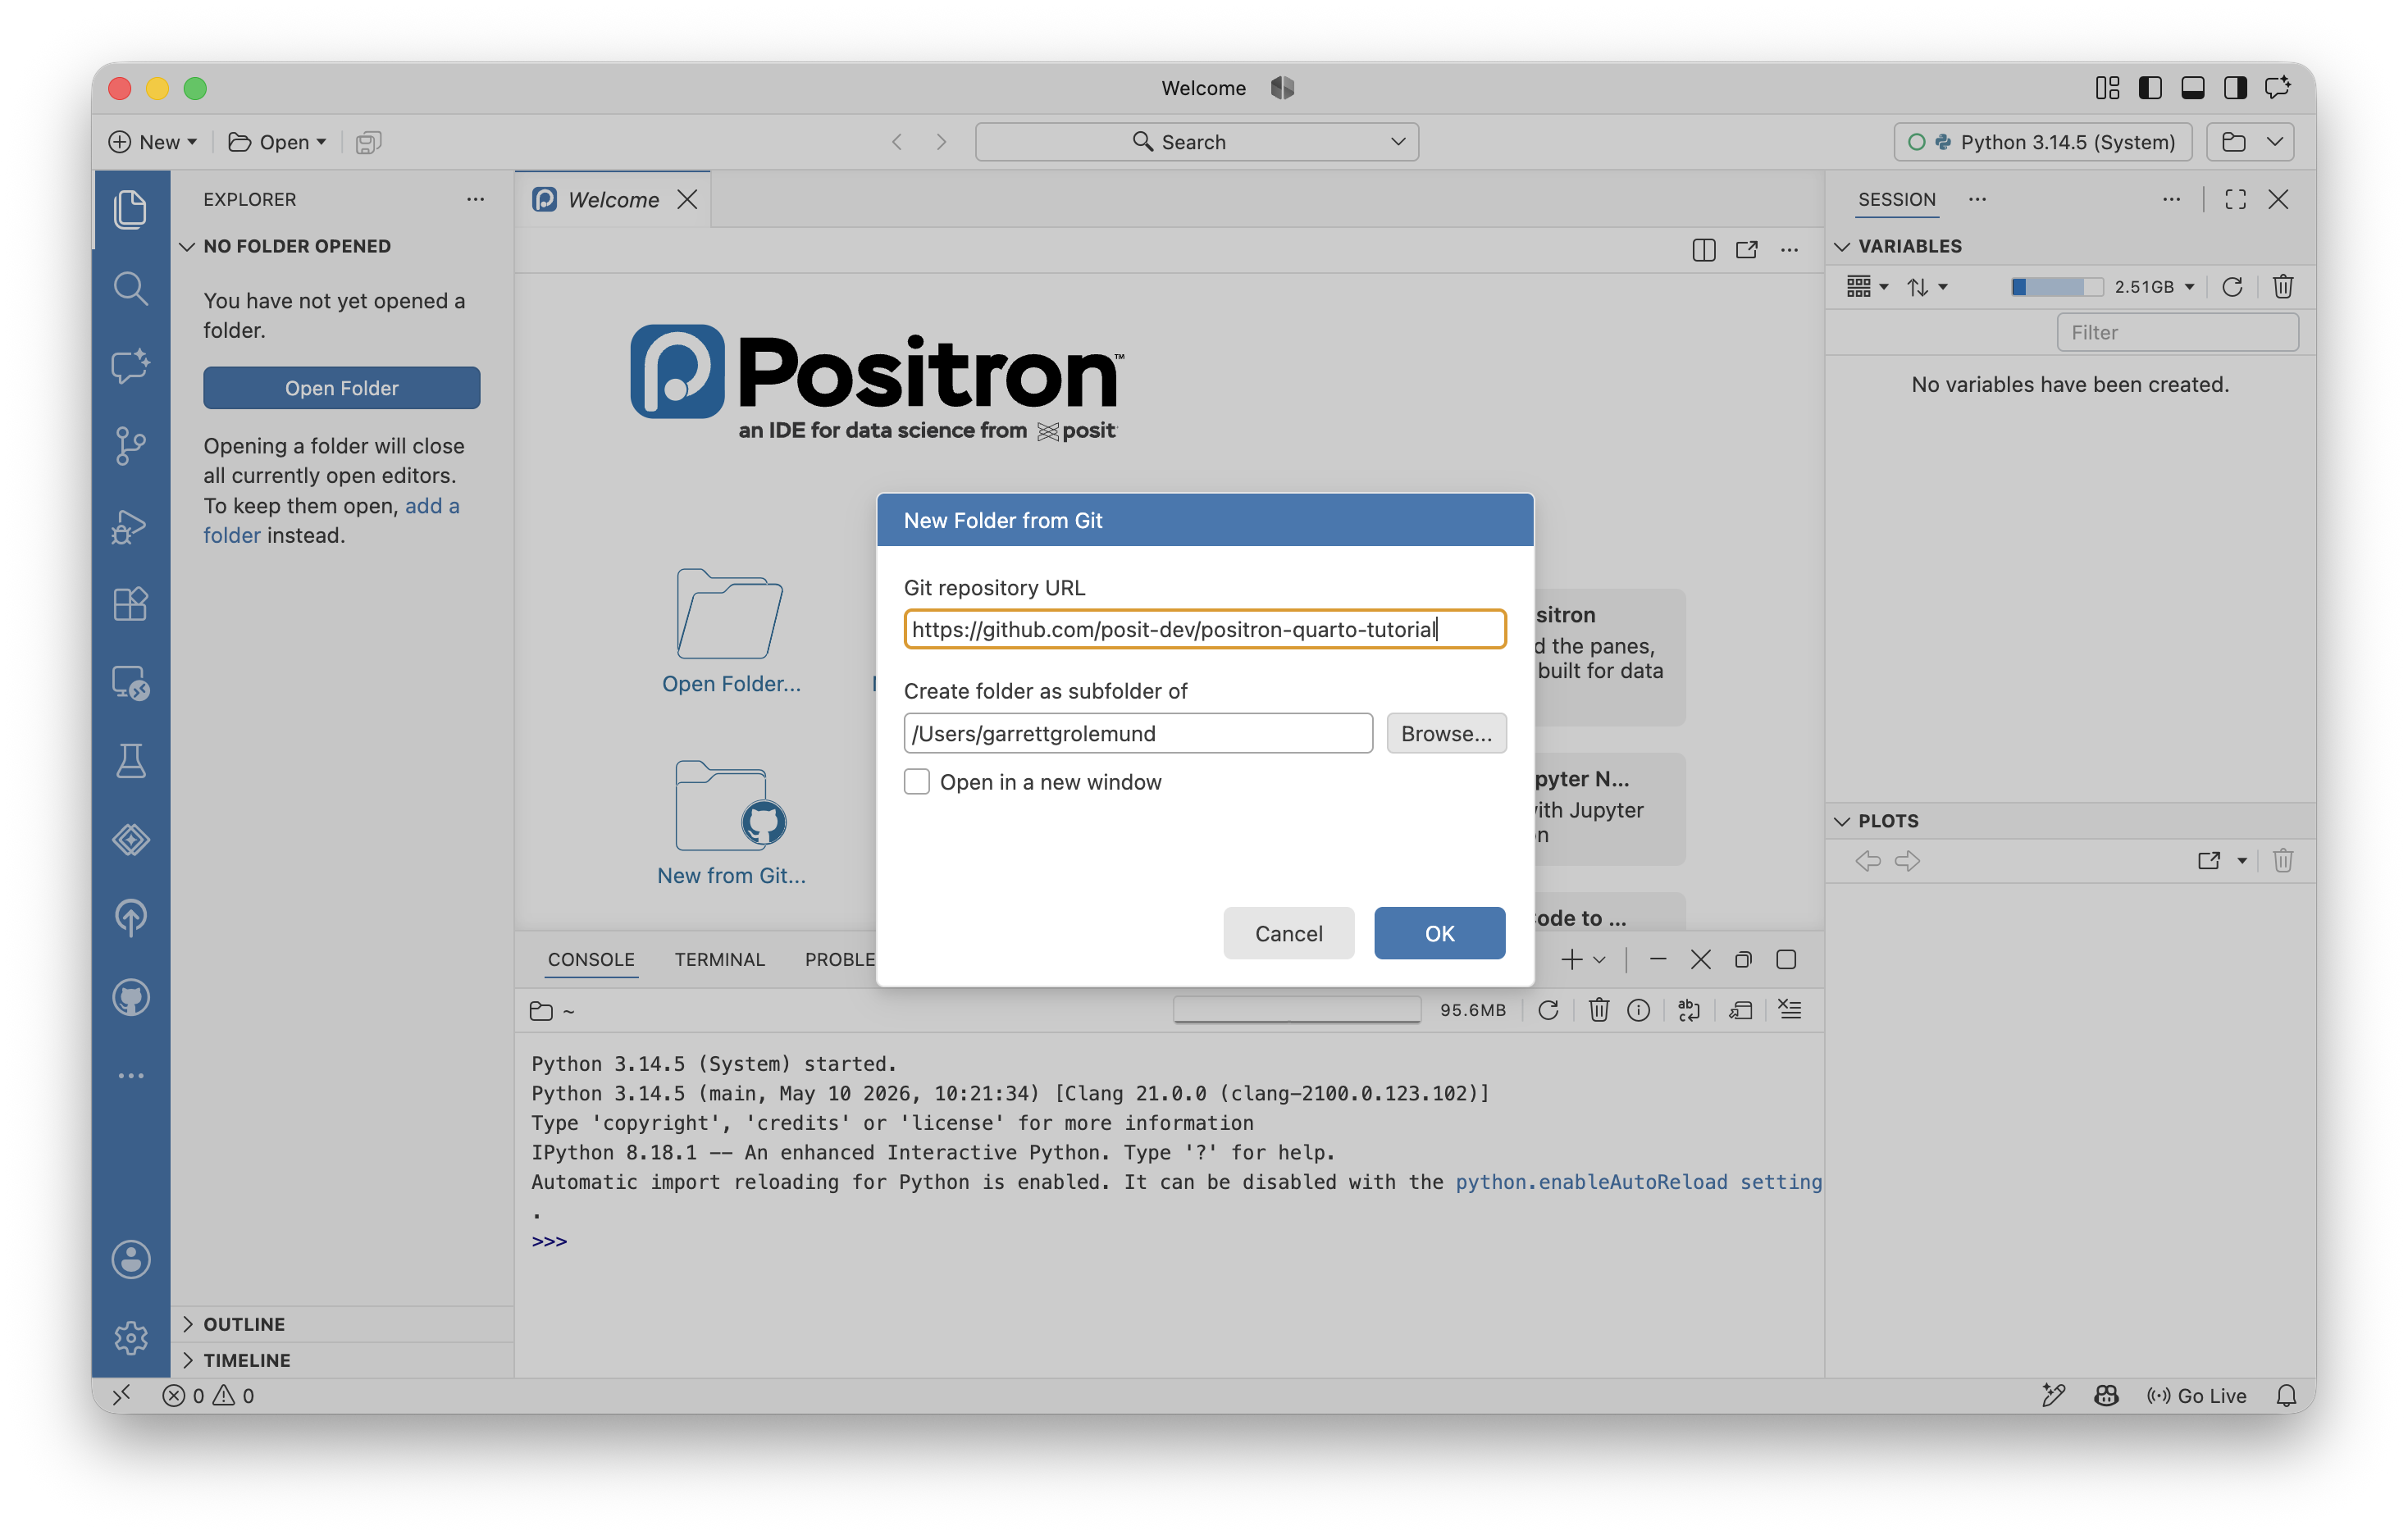
Open the Command Palette with , run Workspaces: New Folder from Git, and paste the repository URL when prompted:
https://github.com/posit-dev/positron-quarto-tutorialChoose a location, then open the cloned folder when Positron offers to.
You will know it worked when the Explorer in the left sidebar shows the project files, including a data folder and an renv.lock file.
Explore the data in the Data Explorer
Take a look at the data before setting a goal. The dataset is an Excel file, data/retail_sales.xlsx. You can open Excel files directly in the Positron Data Explorer and inspect them without writing any code. Just double-click the file name.
The Data Explorer is a sortable, filterable table with per-column summary statistics. It gives you four ways to get your bearings in an unfamiliar table:
- Scroll through the rows or columns to see cell values. Pin a row or column so it stays in view while you scroll.
- Sort on a column by clicking its header.
- Filter to a subset of the data with the filter controls in the table header.
- View summary statistics for each column in the expandable sidebar.
In the Explorer, double-click data/retail_sales.xlsx. It opens in the Data Explorer as a table of retail orders.
- Scroll down to get a feel for the roughly 9,800 rows.
- Pin the
order_idcolumn so it stays visible. - Sort by
salesto find the largest single order. On which date did it occur?
You will know it worked when you can name the two columns this analysis will need: order_date and sales.
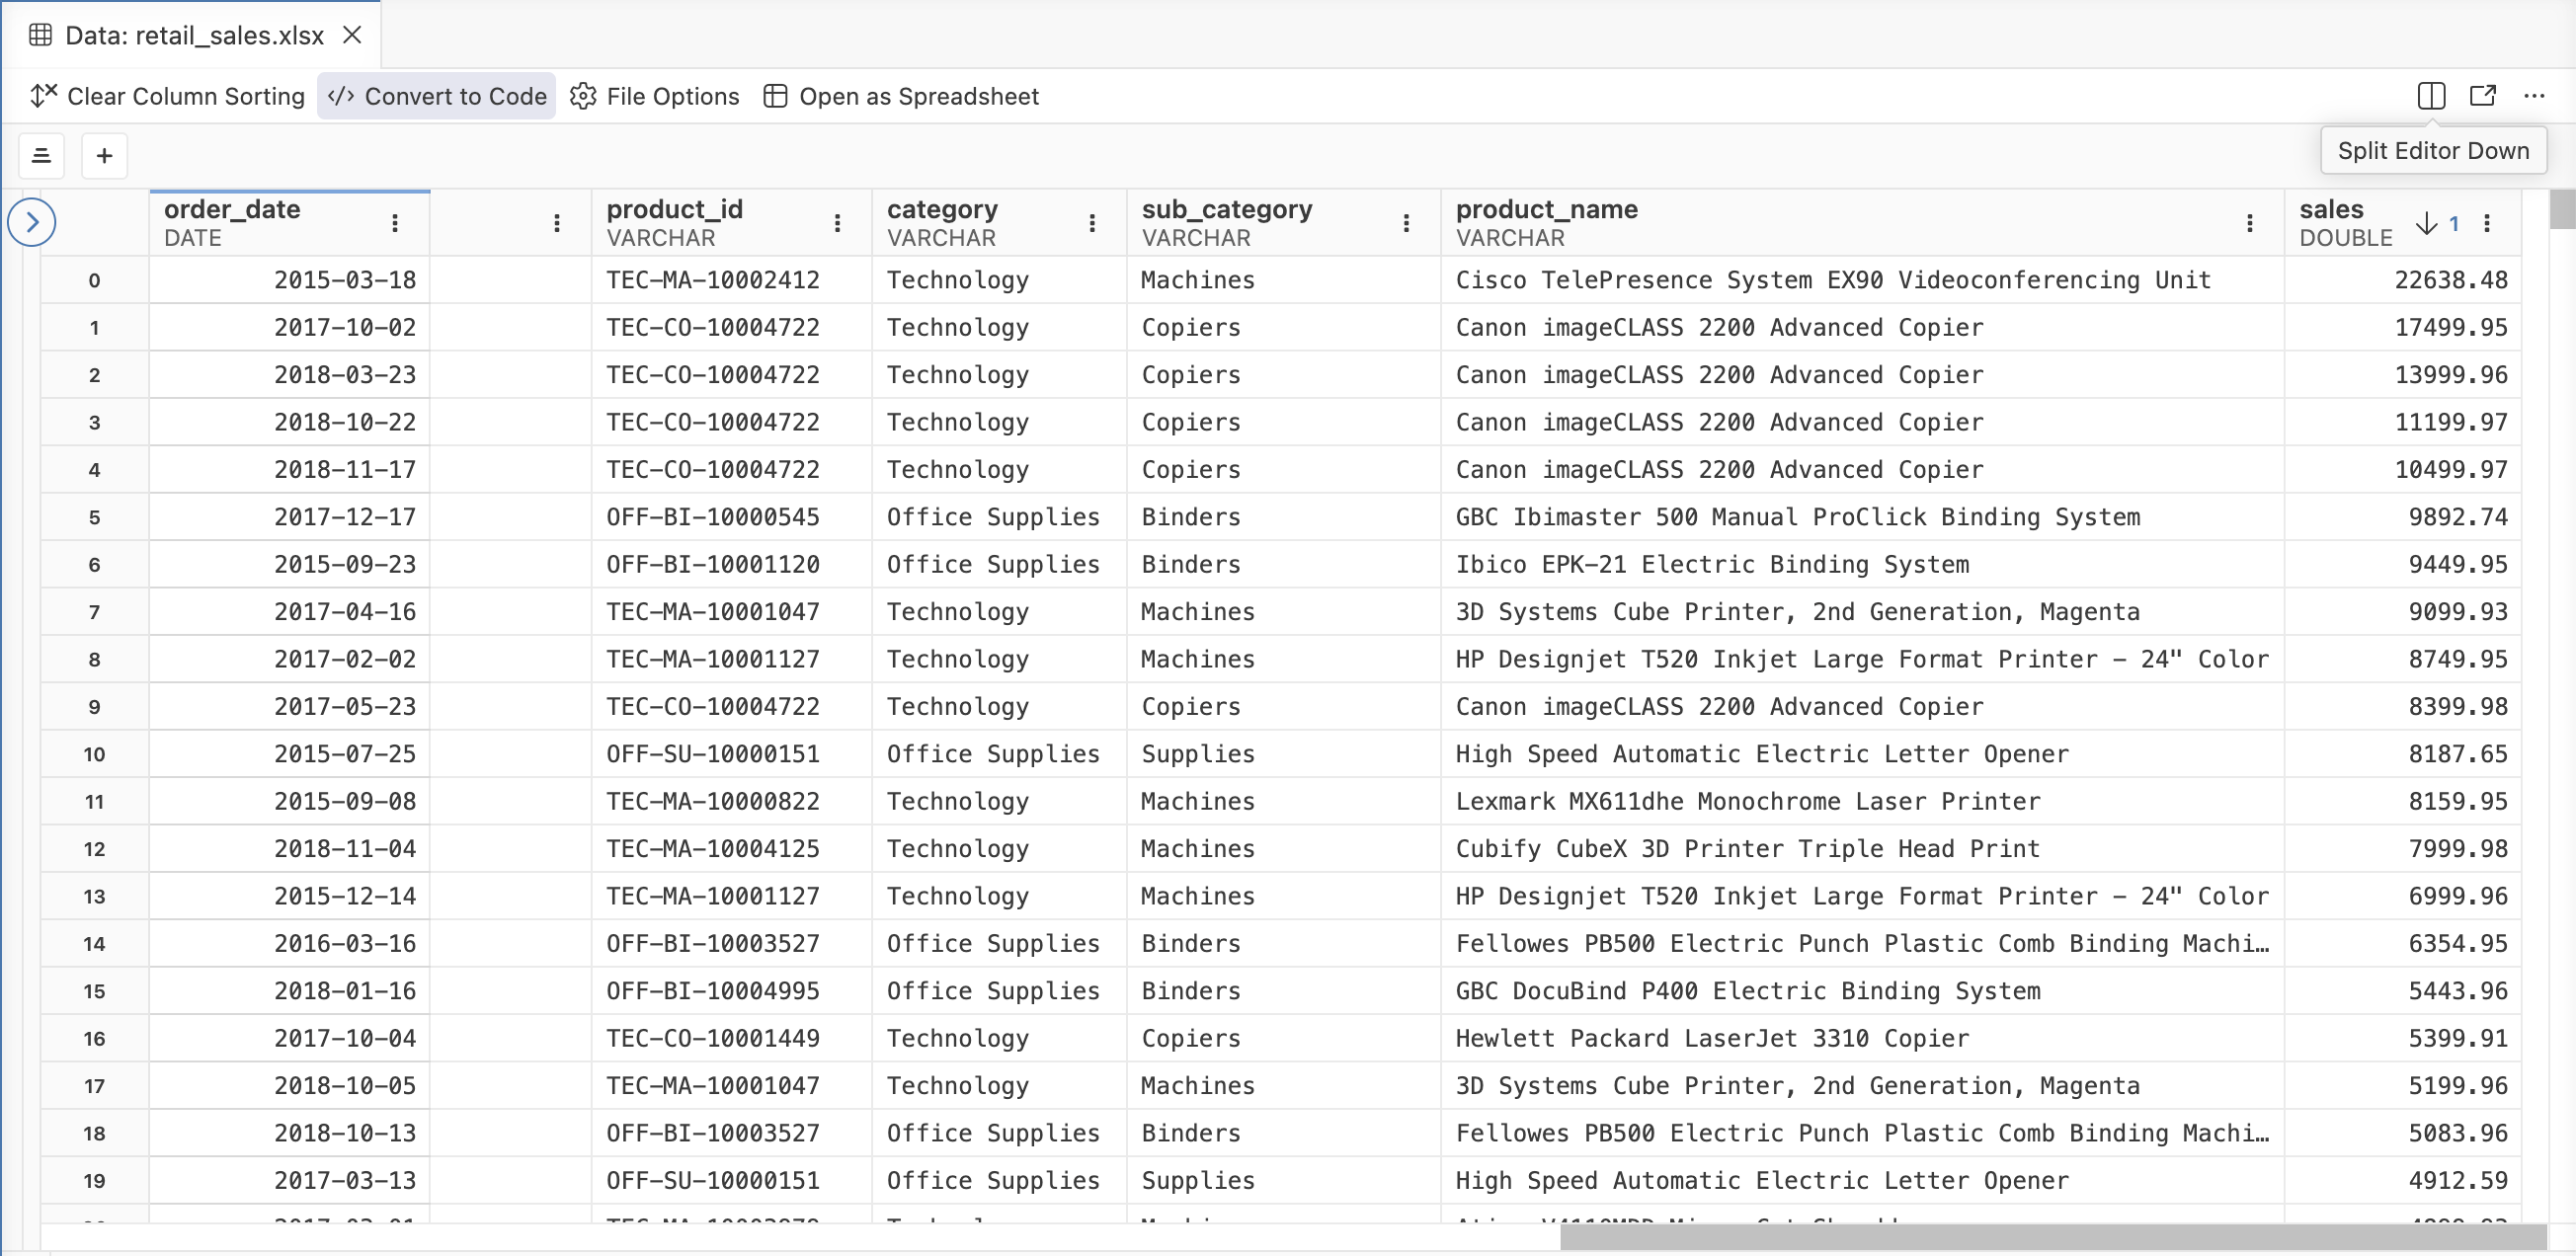
retail_sales.xlsx open in the Data Explorer with columns pinned and sortedSet a goal
Now that you know the data, here is the goal: aggregate the orders into total sales per quarter, then visualize the trend.
To keep a reproducible record, you will save the work as R code. That means the next step is to set up Positron to run R for this project.
Set up a reproducible R environment
renv is an R package that records the exact package versions a project uses in an renv.lock file and restores them into a project-local library. Its packages stay separate from everything else on your computer, so this analysis keeps working even as you update packages elsewhere. The renv.lock in the workshop repository pins the versions the analysis needs, including the tidyverse, readxl, and gt packages.
The renv::restore() function reads renv.lock and installs each pinned package into the project library. To use it, first run renv::activate() and restart your session to activate renv. To learn more about renv, see the renv documentation for how it snapshots and restores project dependencies.
- Open the Console (View > Console). If Positron has not yet started an R session, run Interpreter: Start New Console Session, and select an R interpreter.
- Run
renv::activate()in the Console to activate renv. - Run Interpreter: Restart Active Interpreter Session to restart the console.
- Run
renv::restore()in the Console. - When renv lists the packages it will install, confirm to proceed.
You will know it worked when the packages from renv.lock install without errors and an renv folder appears in the Explorer.
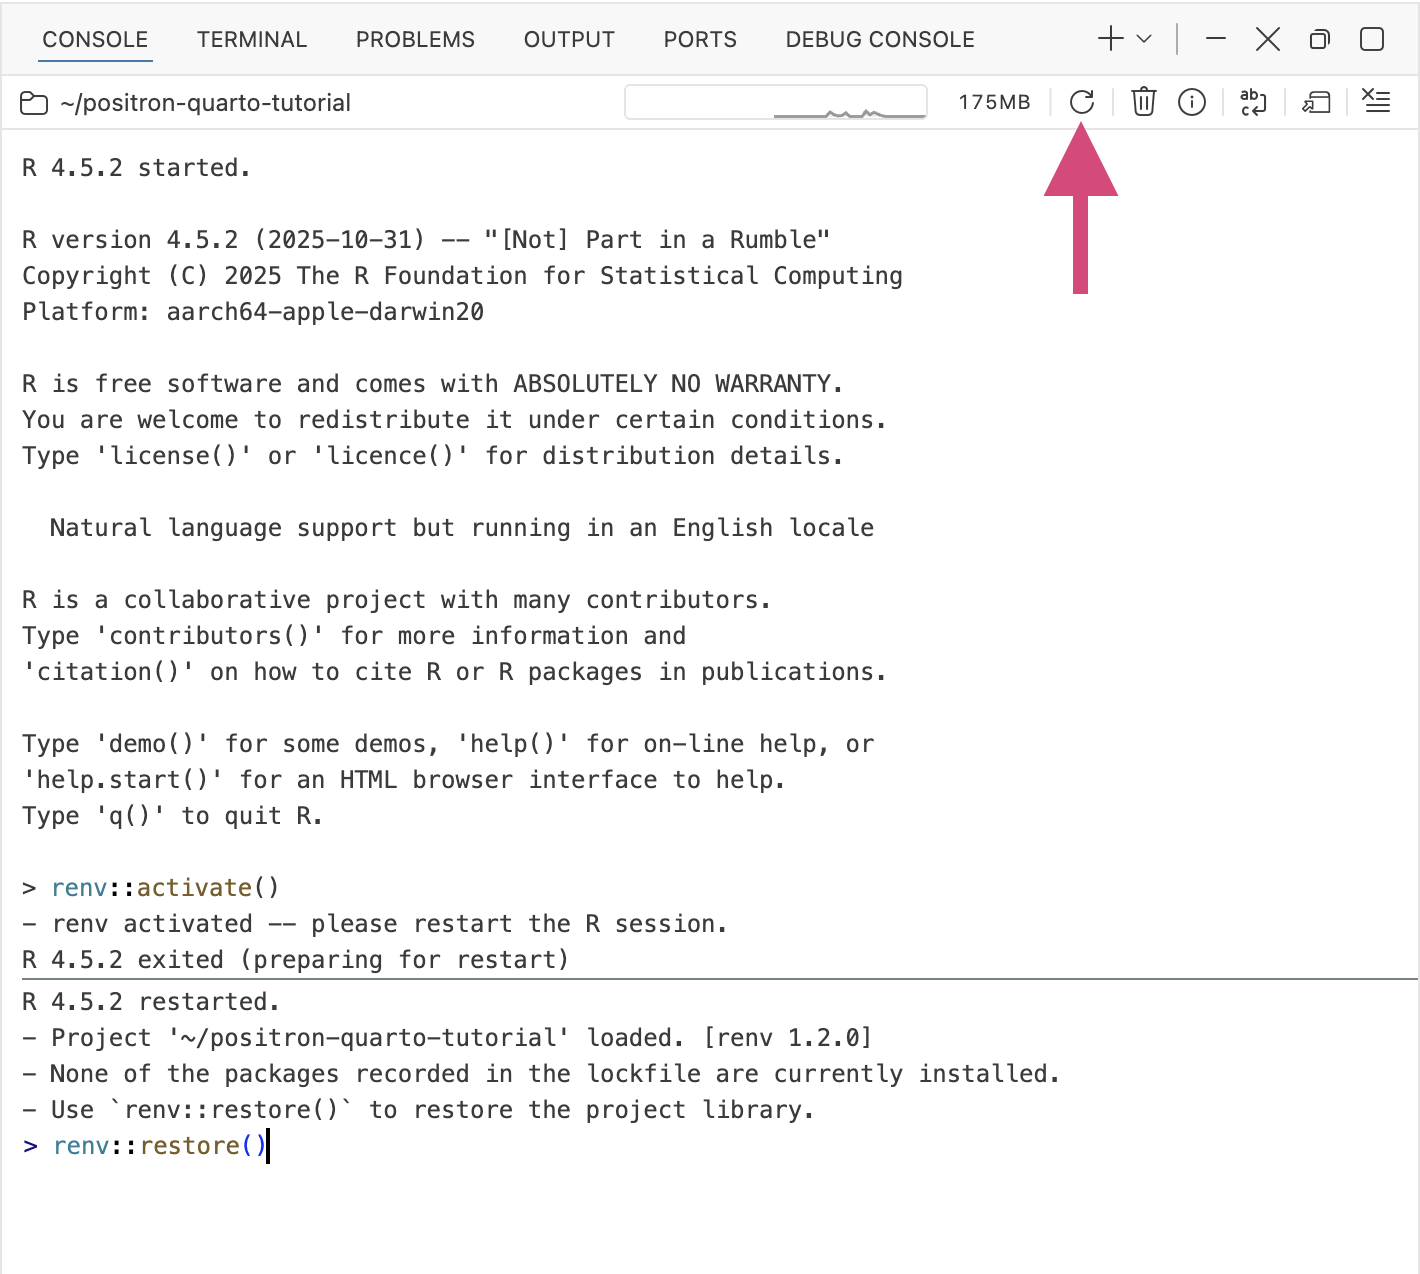
renv::activate()You can also follow along by running install.packages(c("tidyverse", "gt", "rmarkdown")). This installs the packages you are likely to need, avoiding renv.
Configure a language model provider
You can use AI in Positron via Posit Assistant, the AI assistant built into Positron. Posit Assistant does not include a language model of its own. Instead, it sends your prompt, along with context such as your open files and your session’s data, to a language model provider that you choose and sign in to. The provider runs the model and returns the response, which Posit Assistant shows in the chat. You can open Posit Assistant by clicking its icon in the activity bar or by running View: Show Posit Assistant.
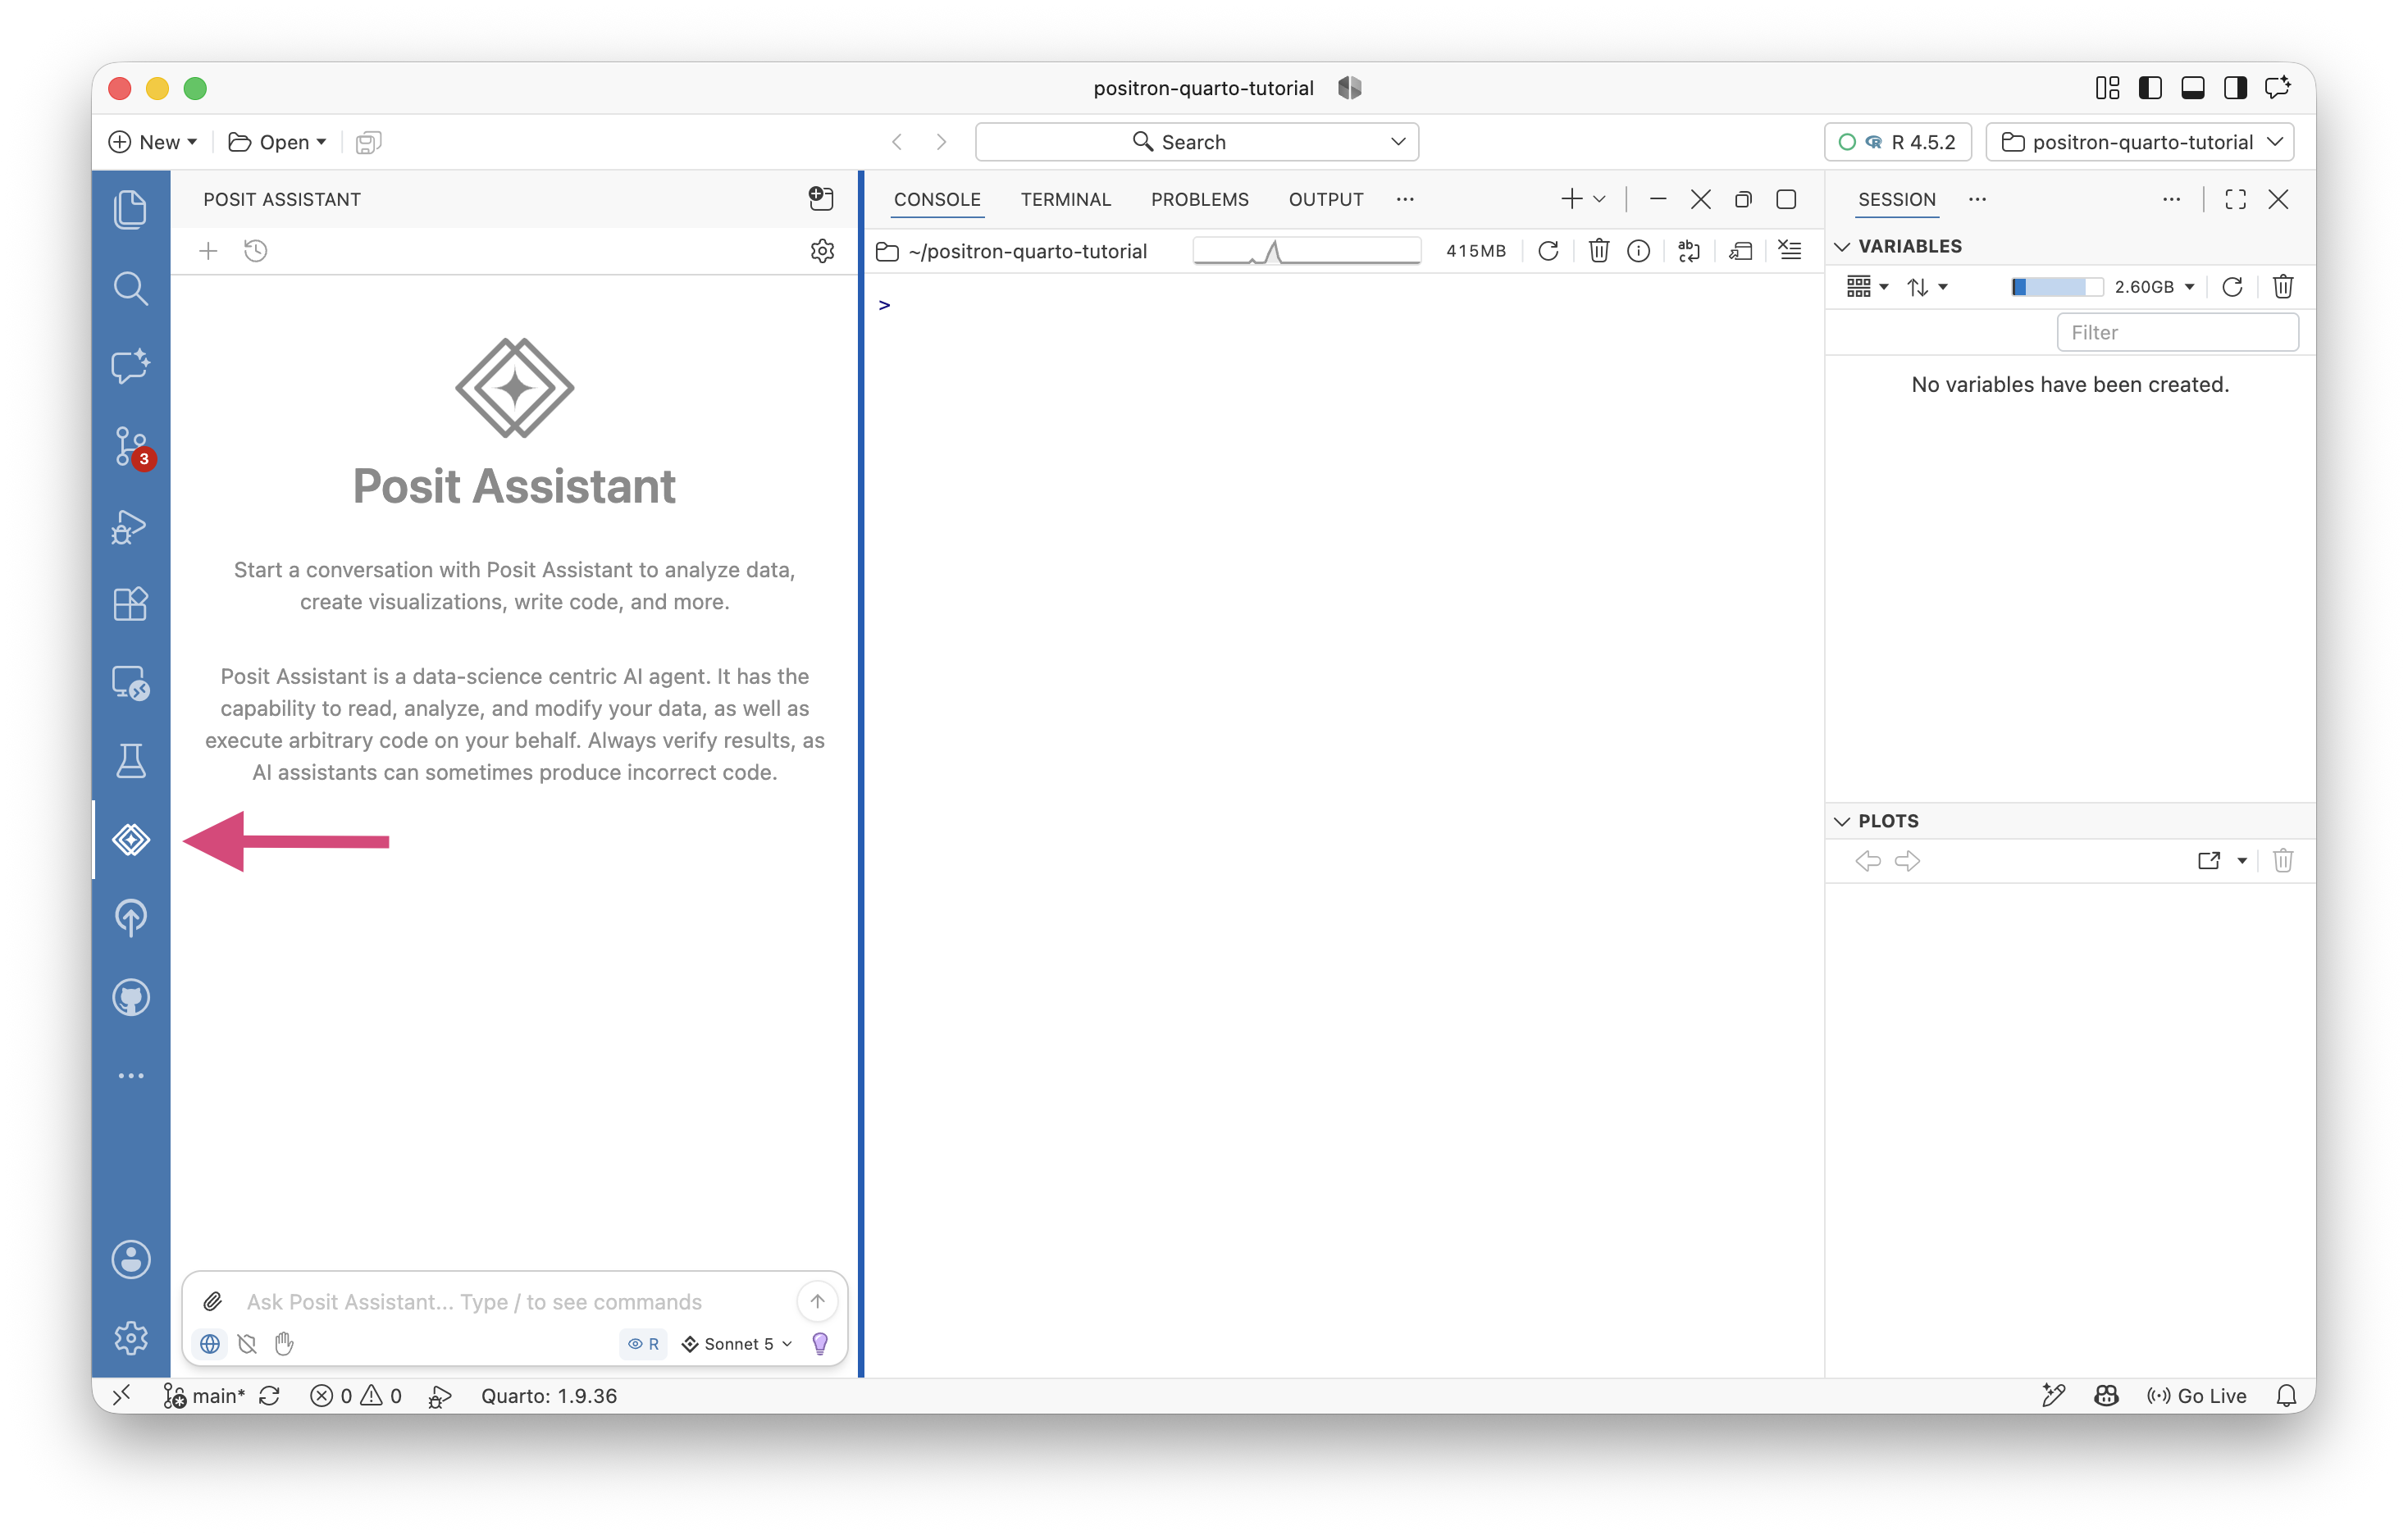
To use Posit Assistant, you must first log in to a model provider with Authentication: Configure Language Model Providers. Posit Assistant lists every provider by default, but none is active until you authenticate with it.
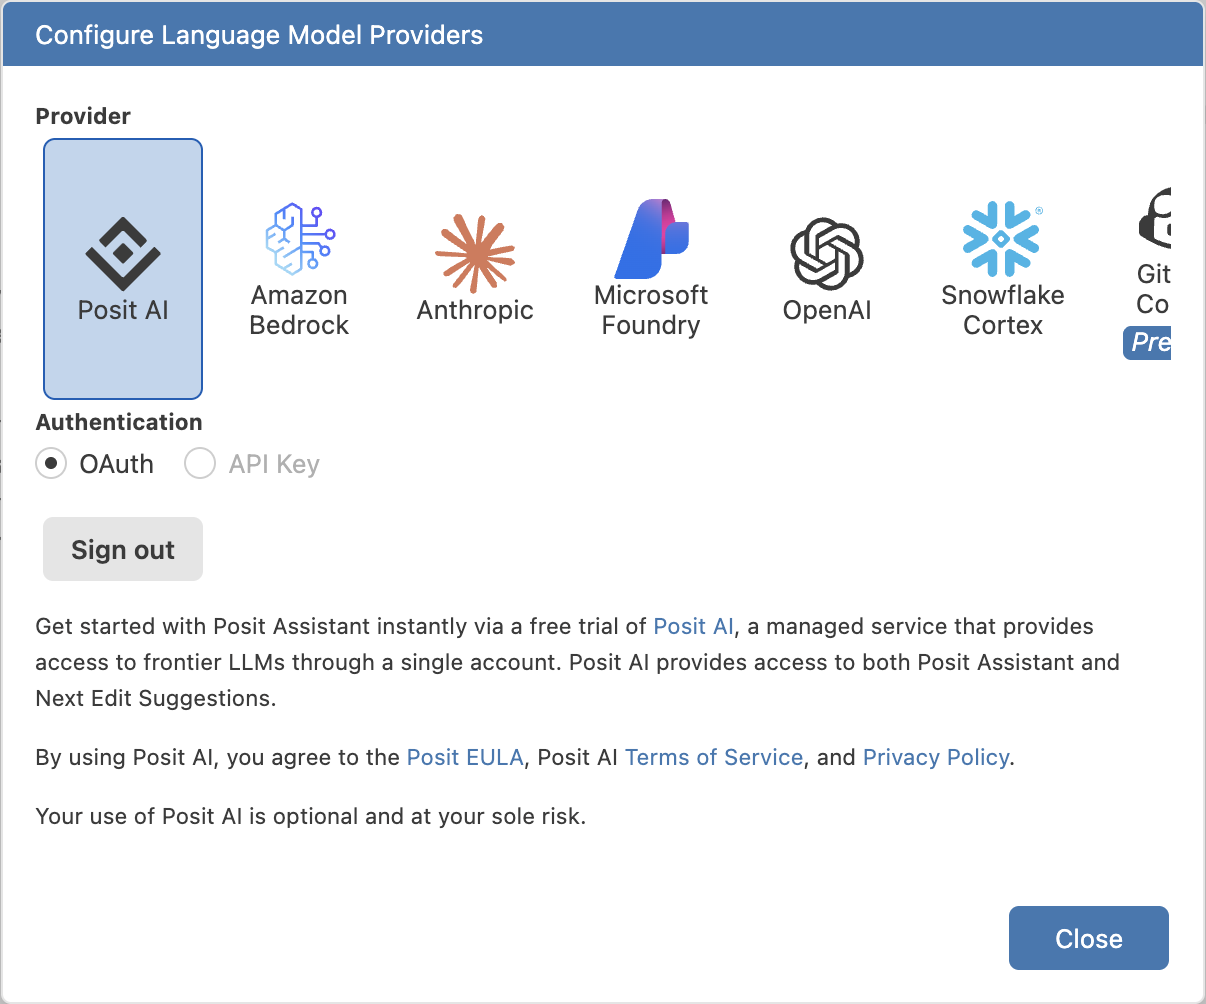
Because providers differ in what account and credentials they need, the steps below are deliberately general. Use whichever provider you already have access to. If you do not have one, Posit AI Pass is the most direct way to get started. You can start a free trial at posit.ai and sign in through your browser, with no API keys to manage.
- Run Authentication: Configure Language Model Providers from the Command Palette.
- Select your provider from the list.
- Complete the sign-in or credential step the provider asks for. The Language Model Providers reference lists what each one needs.
You will know it worked when the provider shows as connected and you can open a chat with View: Show Posit Assistant.
Later in this tutorial you will also use code completions, which require Posit AI Pass or GitHub Copilot. Connecting one of those providers now lets you try that step when you reach it.
Ask Posit Assistant to write the analysis
With a provider connected, describe the analysis in plain language and let Posit Assistant draft the code. A good request names three things, so the assistant knows what to do and how to do it:
- the files to work with
- the packages to use
- the outputs you want
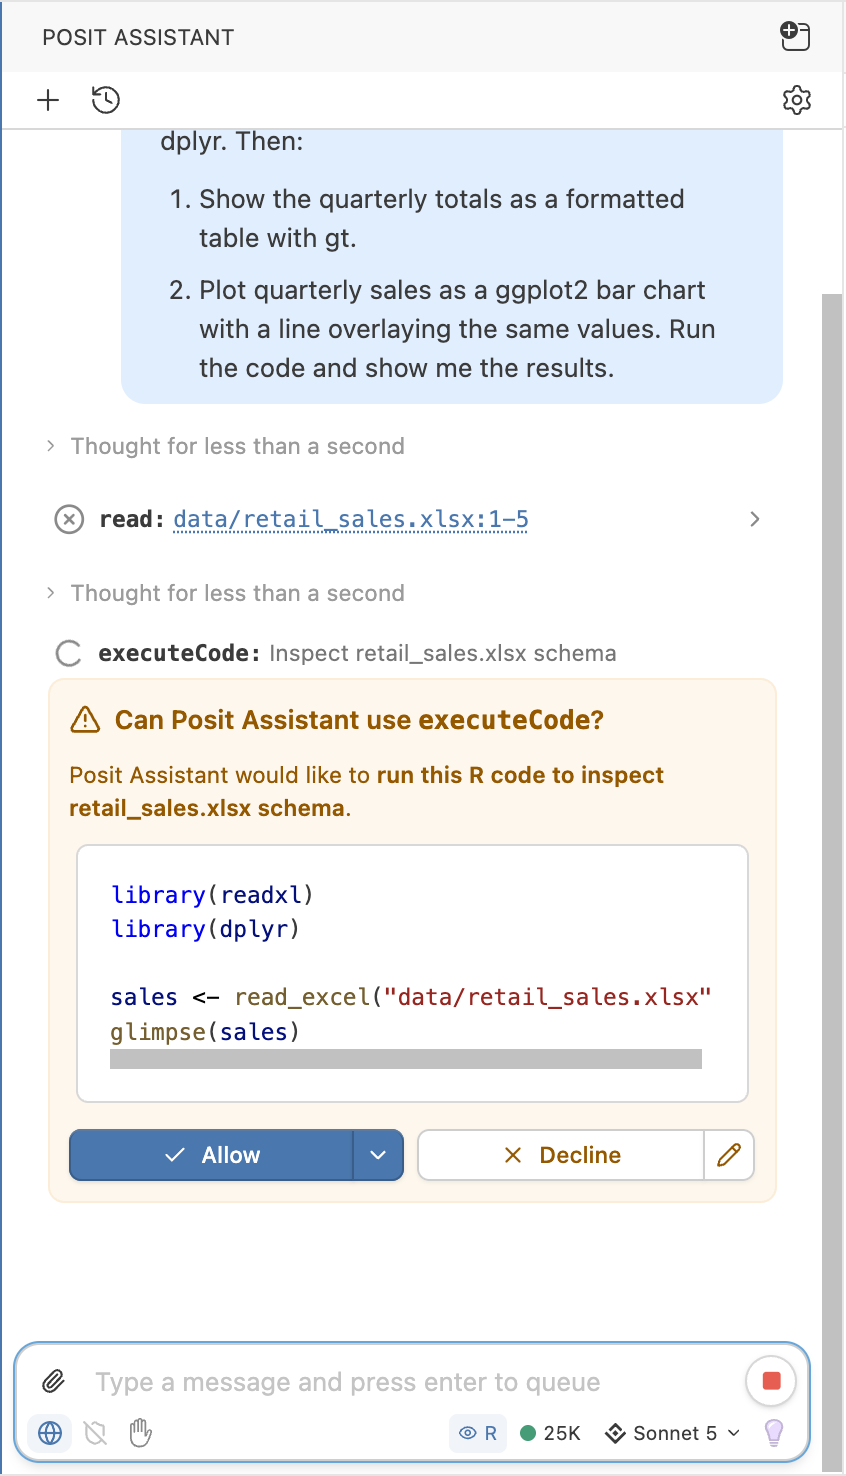
Before you send the request, predict what a correct answer looks like. You want sales grouped by quarter, one row per quarter, and a chart with a bar and a line over the same quarterly totals. Holding that picture in mind makes it easy to judge whether the generated code did the right thing.
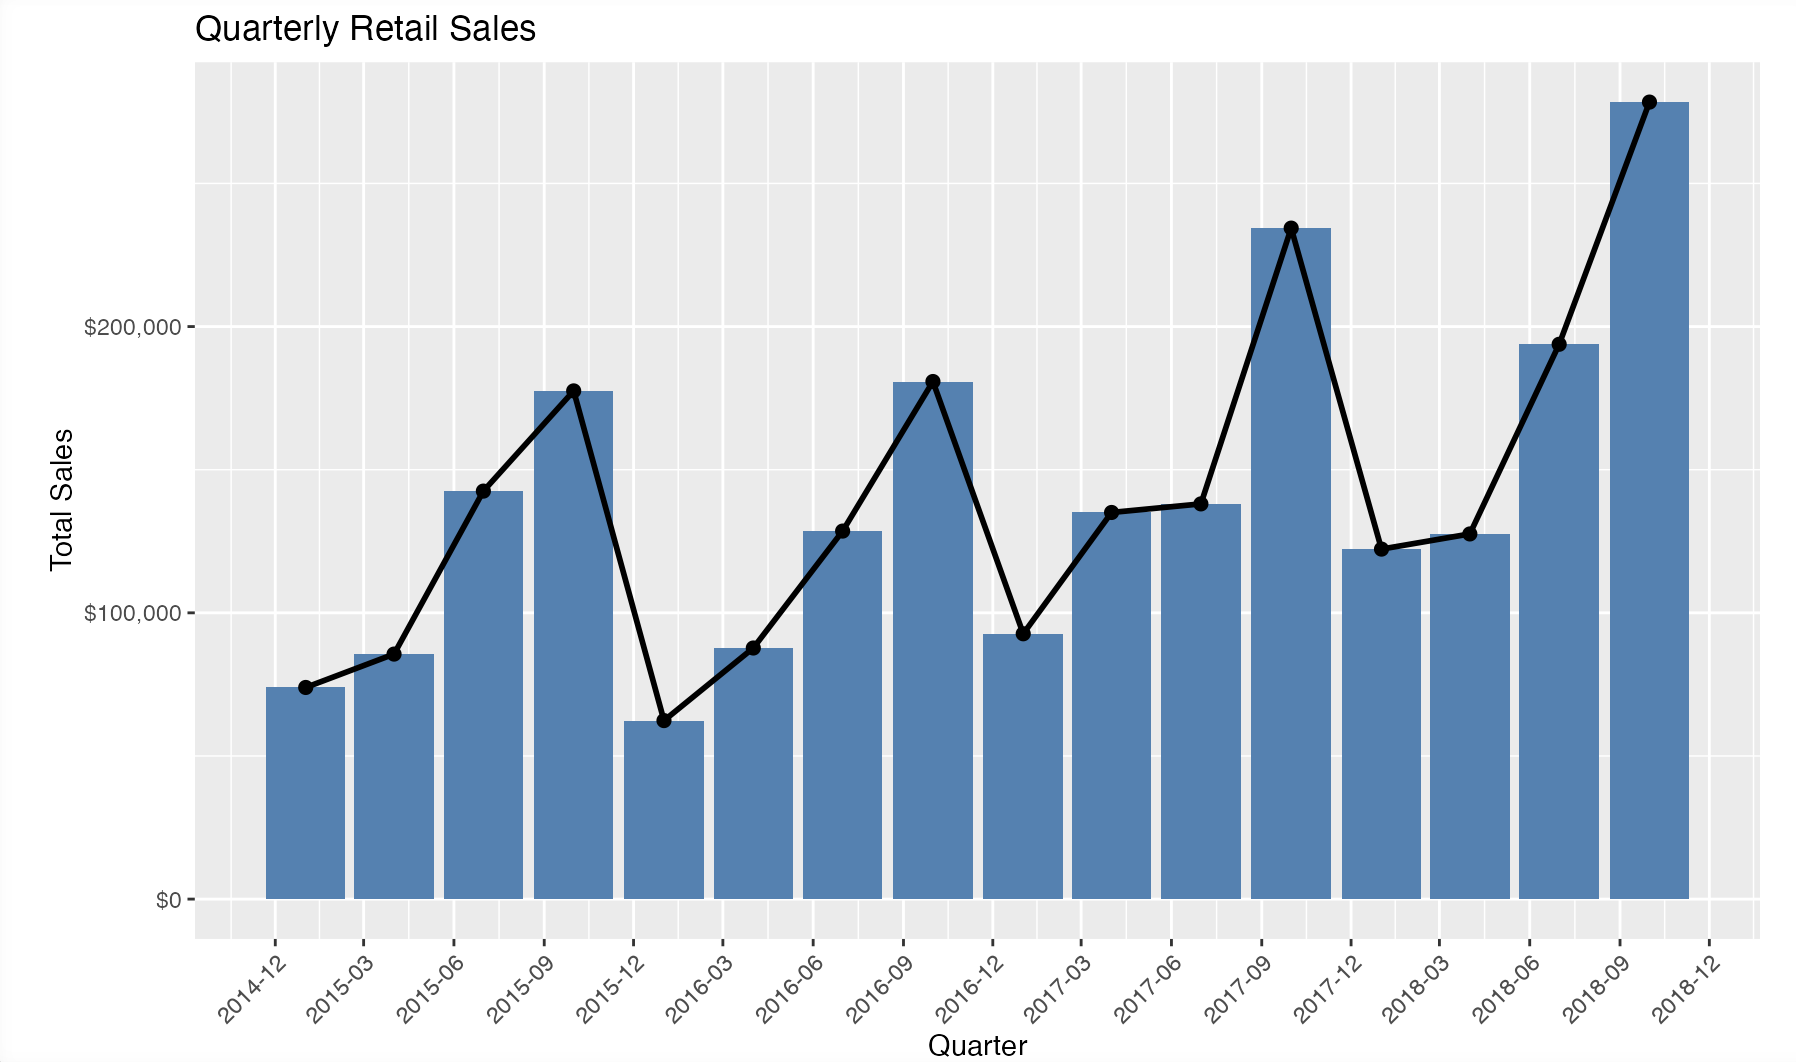
Open Posit Assistant with View: Show Posit Assistant and send this request:
Read data/retail_sales.xlsx into a tibble with readxl.
Parse order_date as a date and aggregate total sales by calendar quarter with dplyr.
Then:
1. Show the quarterly totals as a formatted table with gt.
2. Plot quarterly sales as a ggplot2 bar chart with a line overlaying the same values.
Run the code and show me the results.
Posit Assistant proposes code and, with your permission, runs it in your R session. Review each step before you approve it.
You will know it worked when you see a formatted table of quarterly totals and a bar-and-line chart of sales over time.
Before it runs anything, Posit Assistant asks for permission. You can Accept, Decline, or reply with written instructions to adjust what it does.
Your generated code will vary, but it will resemble this:
library(tidyverse)
library(readxl)
library(gt)

orders <- read_excel("data/retail_sales.xlsx")

quarterly <- orders |>
  mutate(quarter = paste0(year(order_date), " Q", quarter(order_date))) |>
  group_by(quarter) |>
  summarize(sales = sum(sales), .groups = "drop")

quarterly |>
  gt() |>
  fmt_currency(sales)

ggplot(quarterly, aes(x = quarter, y = sales, group = 1)) +
  geom_col(fill = "steelblue") +
  geom_line(color = "black") +
  labs(title = "Quarterly retail sales", x = "Quarter", y = "Sales")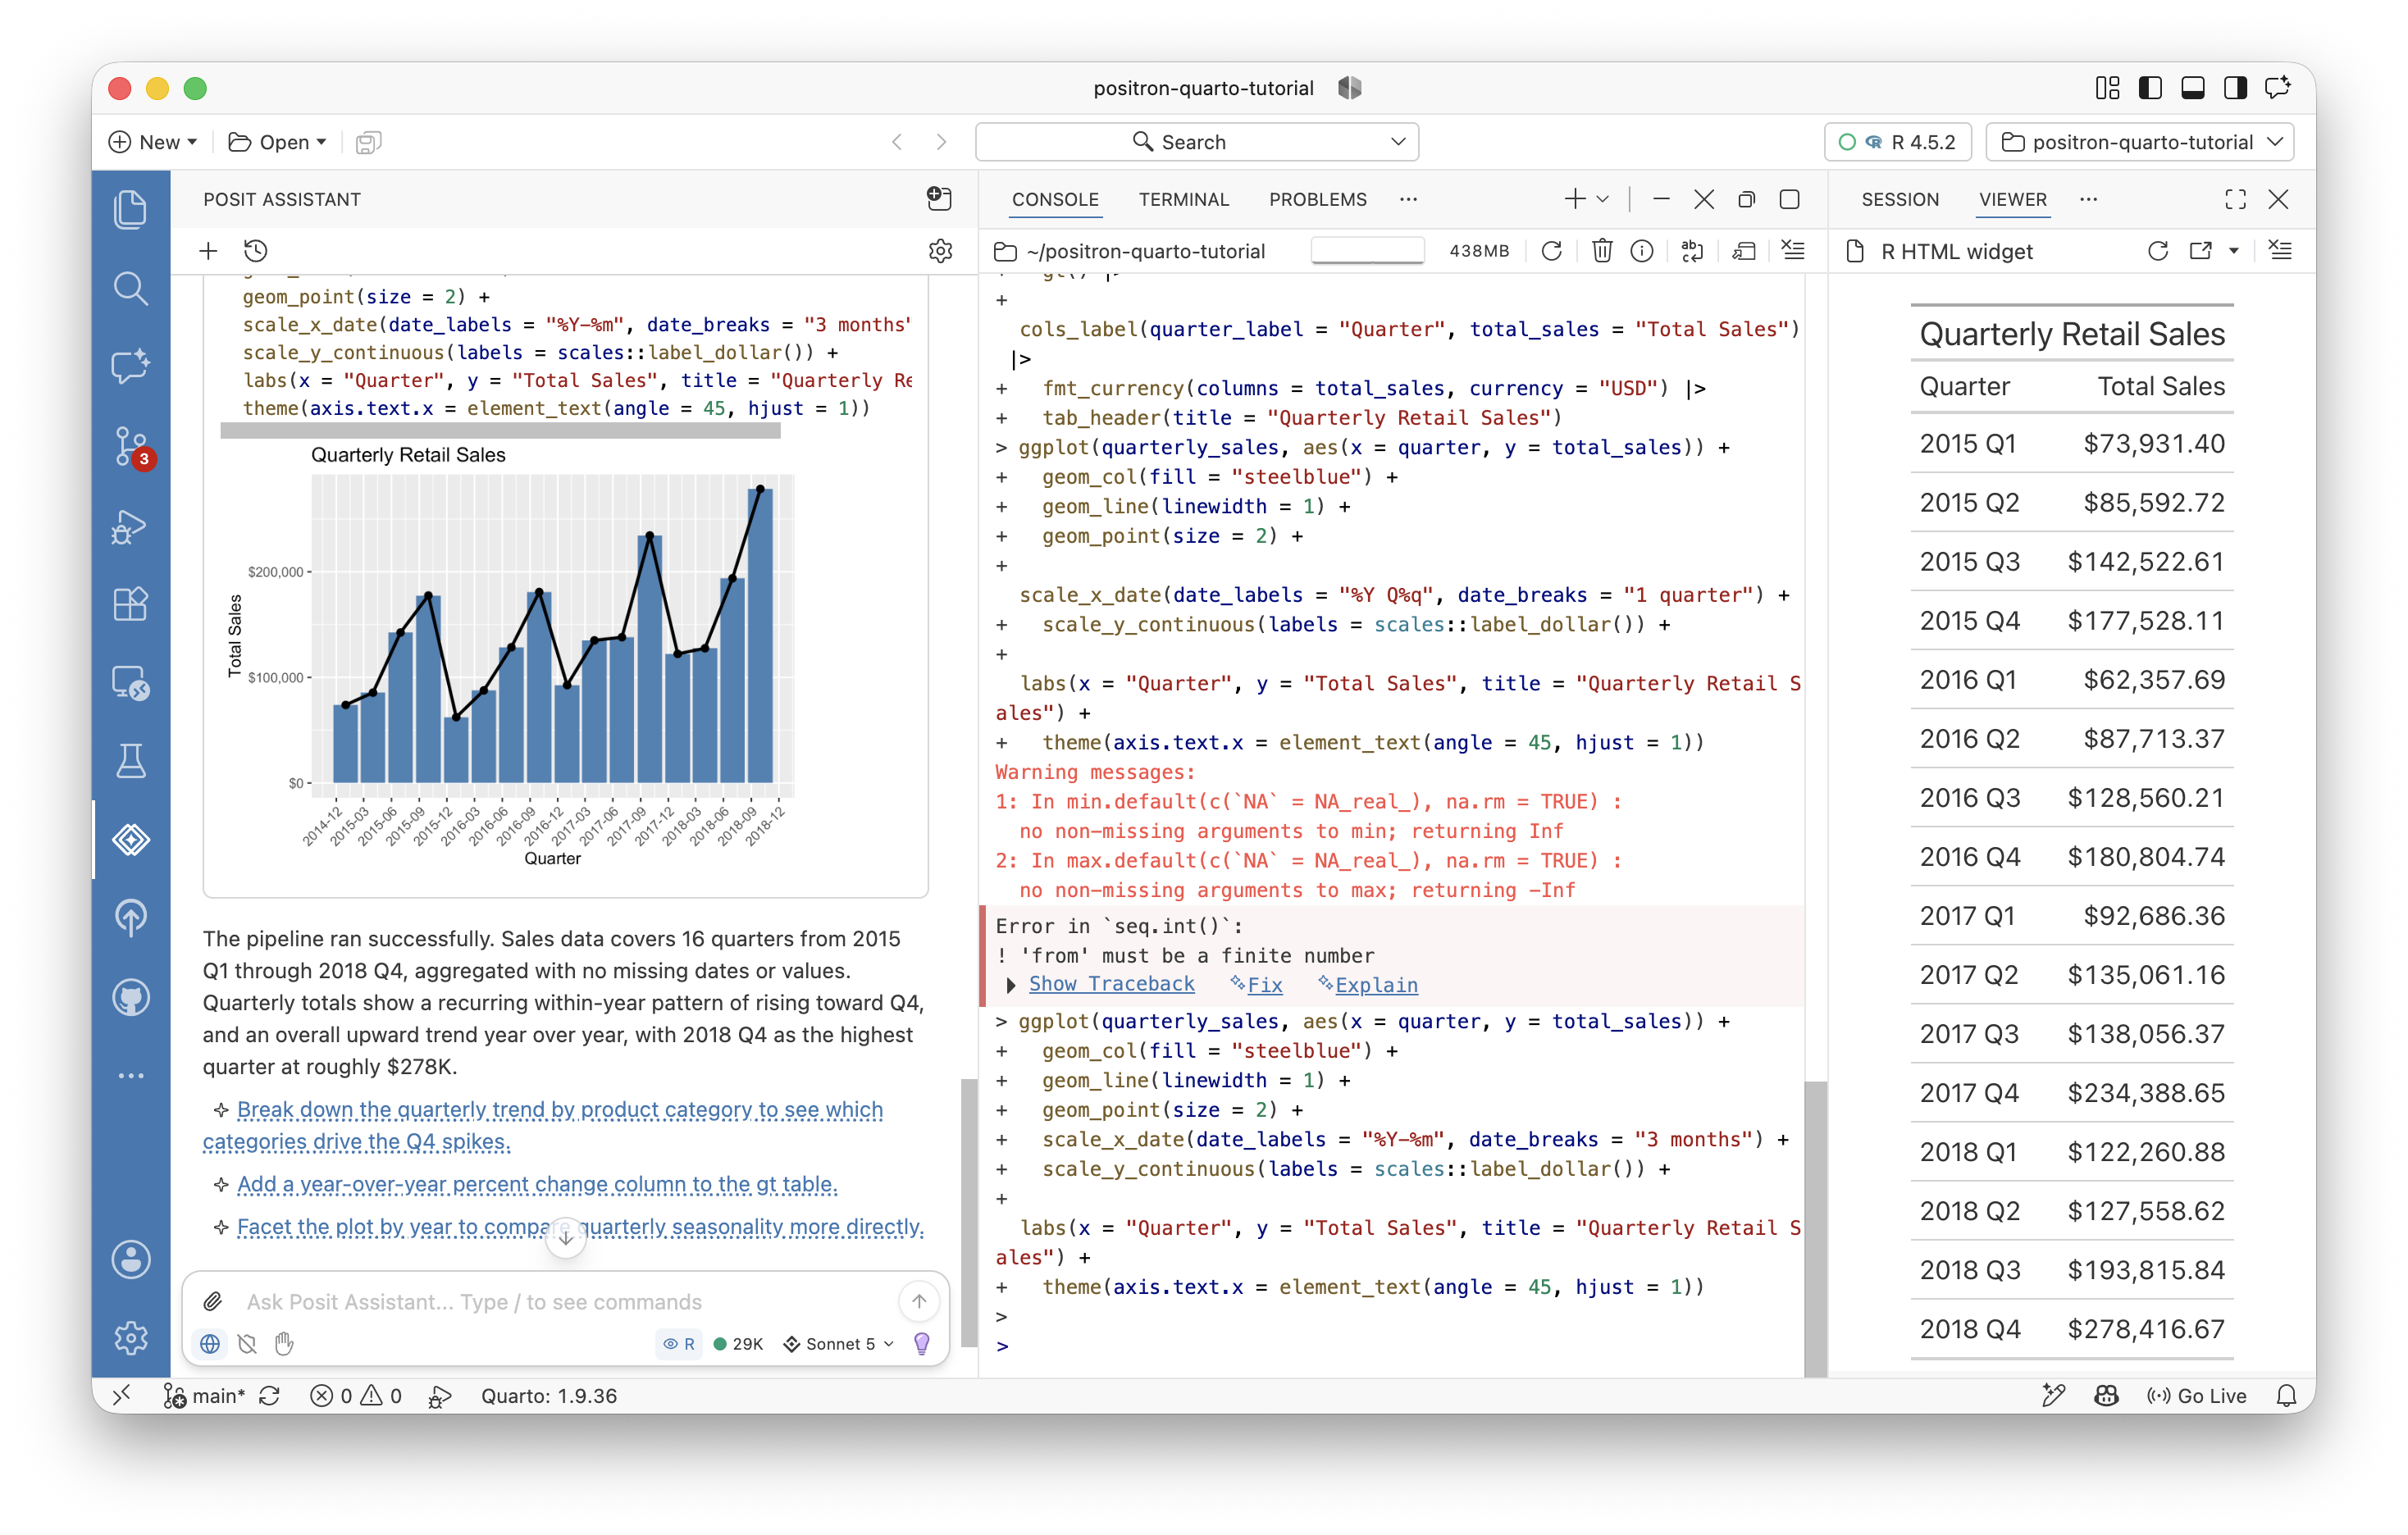
If a result looks off, say so in the same conversation. Posit Assistant keeps the context as it makes revisions, so you can steer it toward the picture you predicted rather than starting over.
Export the conversation as a Quarto document
The analysis works, but right now it lives in a chat. To save it as a reproducible artifact, type /report into the chat to export the conversation as a Quarto document. /report is a command packaged with Posit Assistant that tells the assistant to collect the code and prose from your conversation into a .qmd file that you can rerun, edit, and commit.
A Quarto document is a plain text file that mixes Markdown prose with code cells. It renders to HTML, PDF, Word, and more, so one source can become whatever format your audience needs.
In the same Posit Assistant conversation, type /report and send it. Posit Assistant exports the conversation as a Quarto document and opens the .qmd file in the editor.
You will know it worked when a new .qmd file opens with your analysis laid out as code cells and prose. Save the report. Then click Preview at the top of the file to render an HTML version of the report.
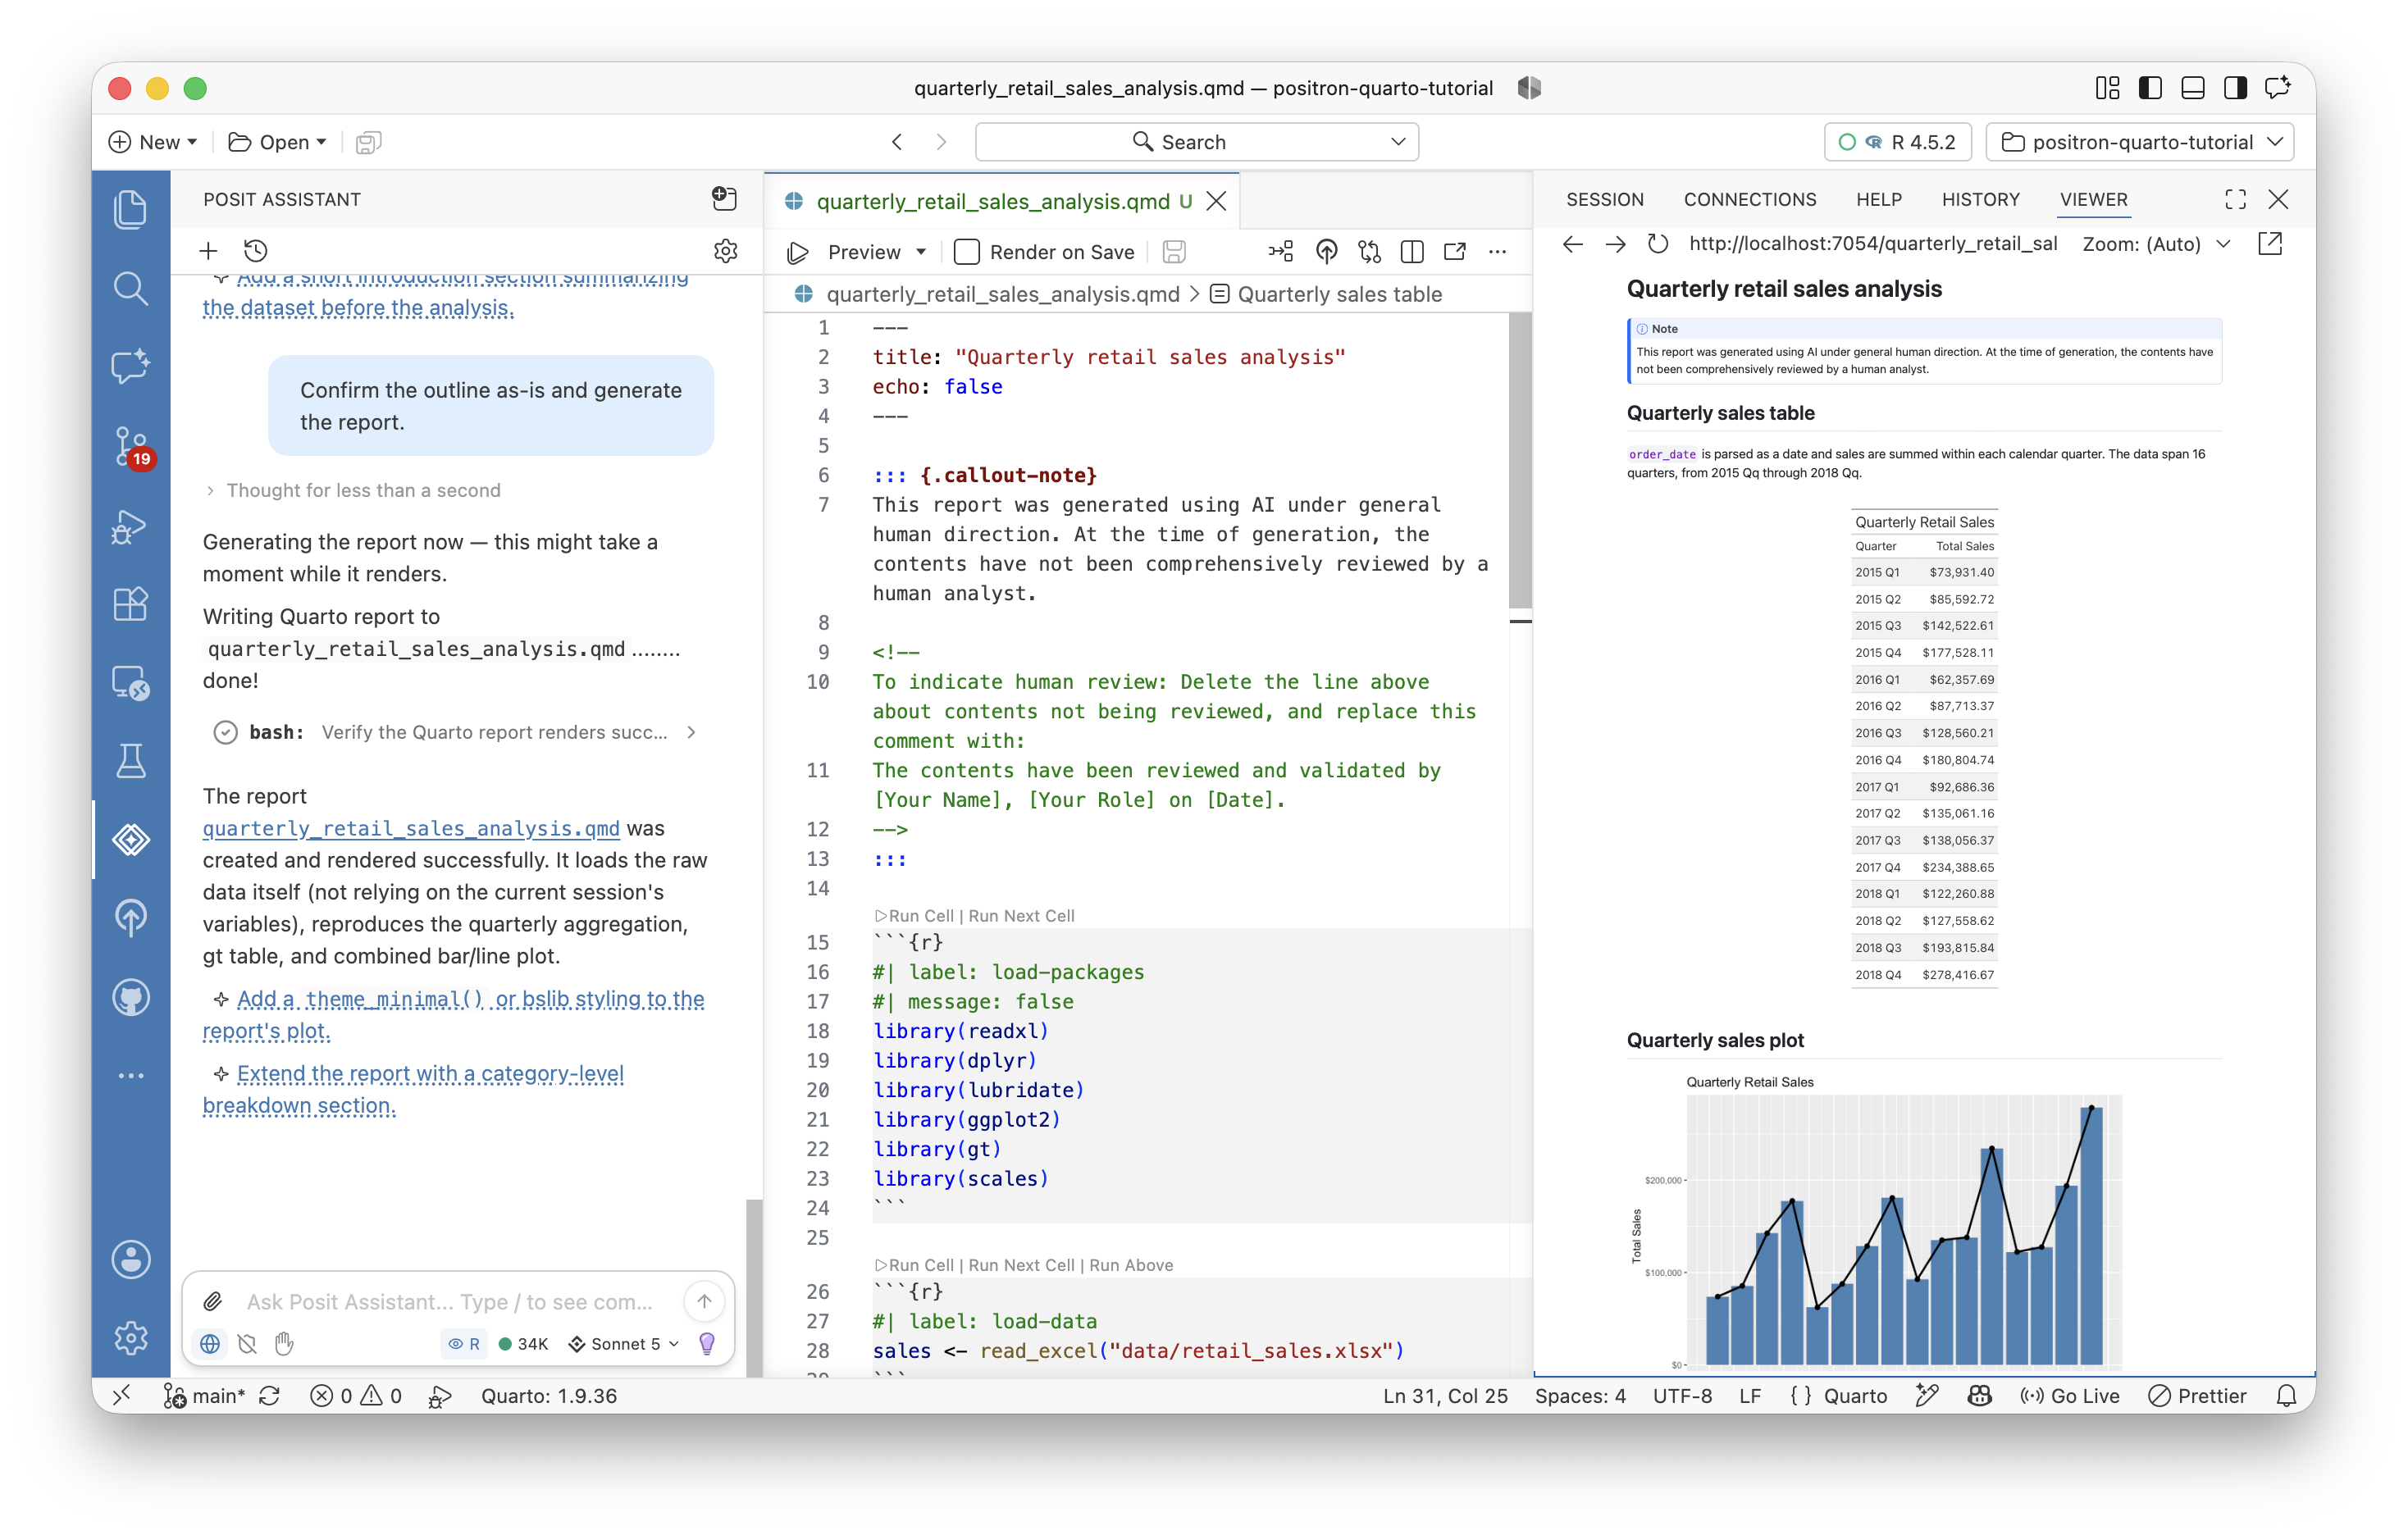
The document runs on the R environment you restored with renv, so it uses the same pinned packages as the rest of the project. That is what makes the exported report reproducible rather than tied to whatever R packages happened to be loaded in your session.
New to the format? See Quarto for how Positron renders and previews .qmd files.
Work with AI inside the Quarto document
You do not have to leave the Quarto document to keep working with Posit Assistant. The same AI you chatted with is available as you edit, through three entry points:
- Fix and Explain buttons appear on any code error message, sending the failure straight to Posit Assistant.
- Code completions suggest the next line as inline ghost text while you type.
- Posit Assistant can edit the document when you ask it to from the chat.
The next three sections put each of these to work.
Fix a cell error with one click
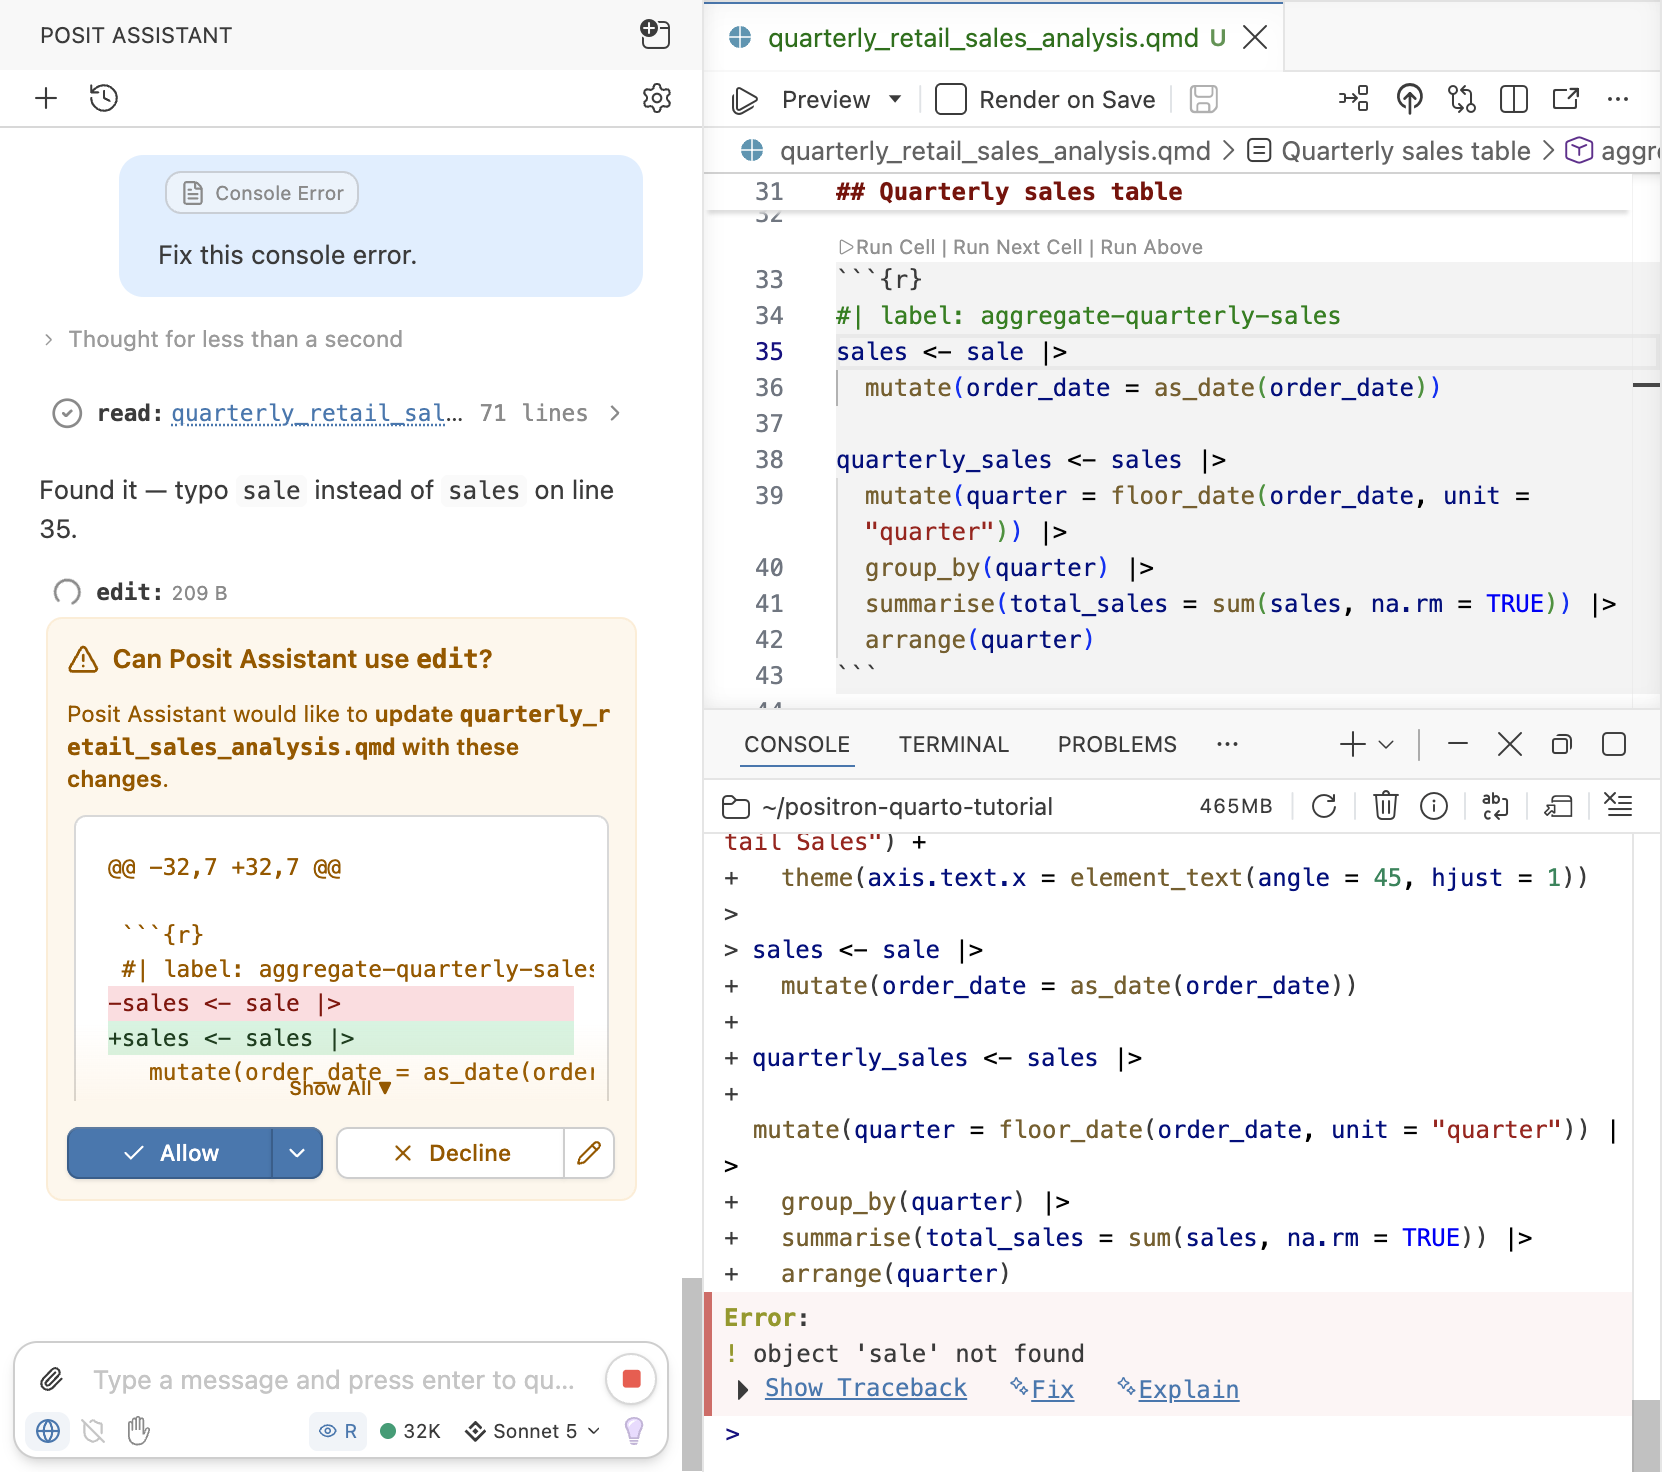
Errors are a normal part of an analysis, and the fastest AI win is fixing one without copying the traceback anywhere. When a cell fails, Positron shows Fix and Explain buttons right on the error output. Fix sends the code and the error to Posit Assistant and proposes a corrected cell. Explain describes the cause without editing anything.
Introduce a small, deliberate error so you can practice the recovery. In any cell, misspell a column name, for example change sales to sale, and run it. When the cell fails:
- Click Fix on the error output.
- Read the correction Posit Assistant proposes.
- Accept it and rerun the cell.
You will know it worked when Posit Assistant identifies the wrong column name, restores sales, and the cell runs cleanly.
Complete a line of code as you type
Code completions suggest the next line as you type, drawn from the context of the surrounding code. The suggestion appears in faded ghost text that you accept with a keypress, so you fill in familiar code without typing every character. Posit AI Pass or GitHub Copilot powers completions, so connect one of those providers if you have not already.
Add a new R code cell at the end of the document with . Start typing a line that reports the quarter with the highest sales, such as:
quarterly |> filter(sales ==Pause and wait for the ghost text to appear.
- Read the suggested completion.
- Press TabTab to accept it, or keep typing to dismiss it.
- Run the cell to confirm it returns the top quarter.
You will know it worked when a greyed-out suggestion appears as you type and becomes real code once you press TabTab.

Extend the analysis with Posit Assistant
Posit Assistant can edit the open Quarto document directly, not just answer in the chat. That lets you grow the analysis by describing the next piece and letting the assistant add it in place, where you can review the change before you keep it.
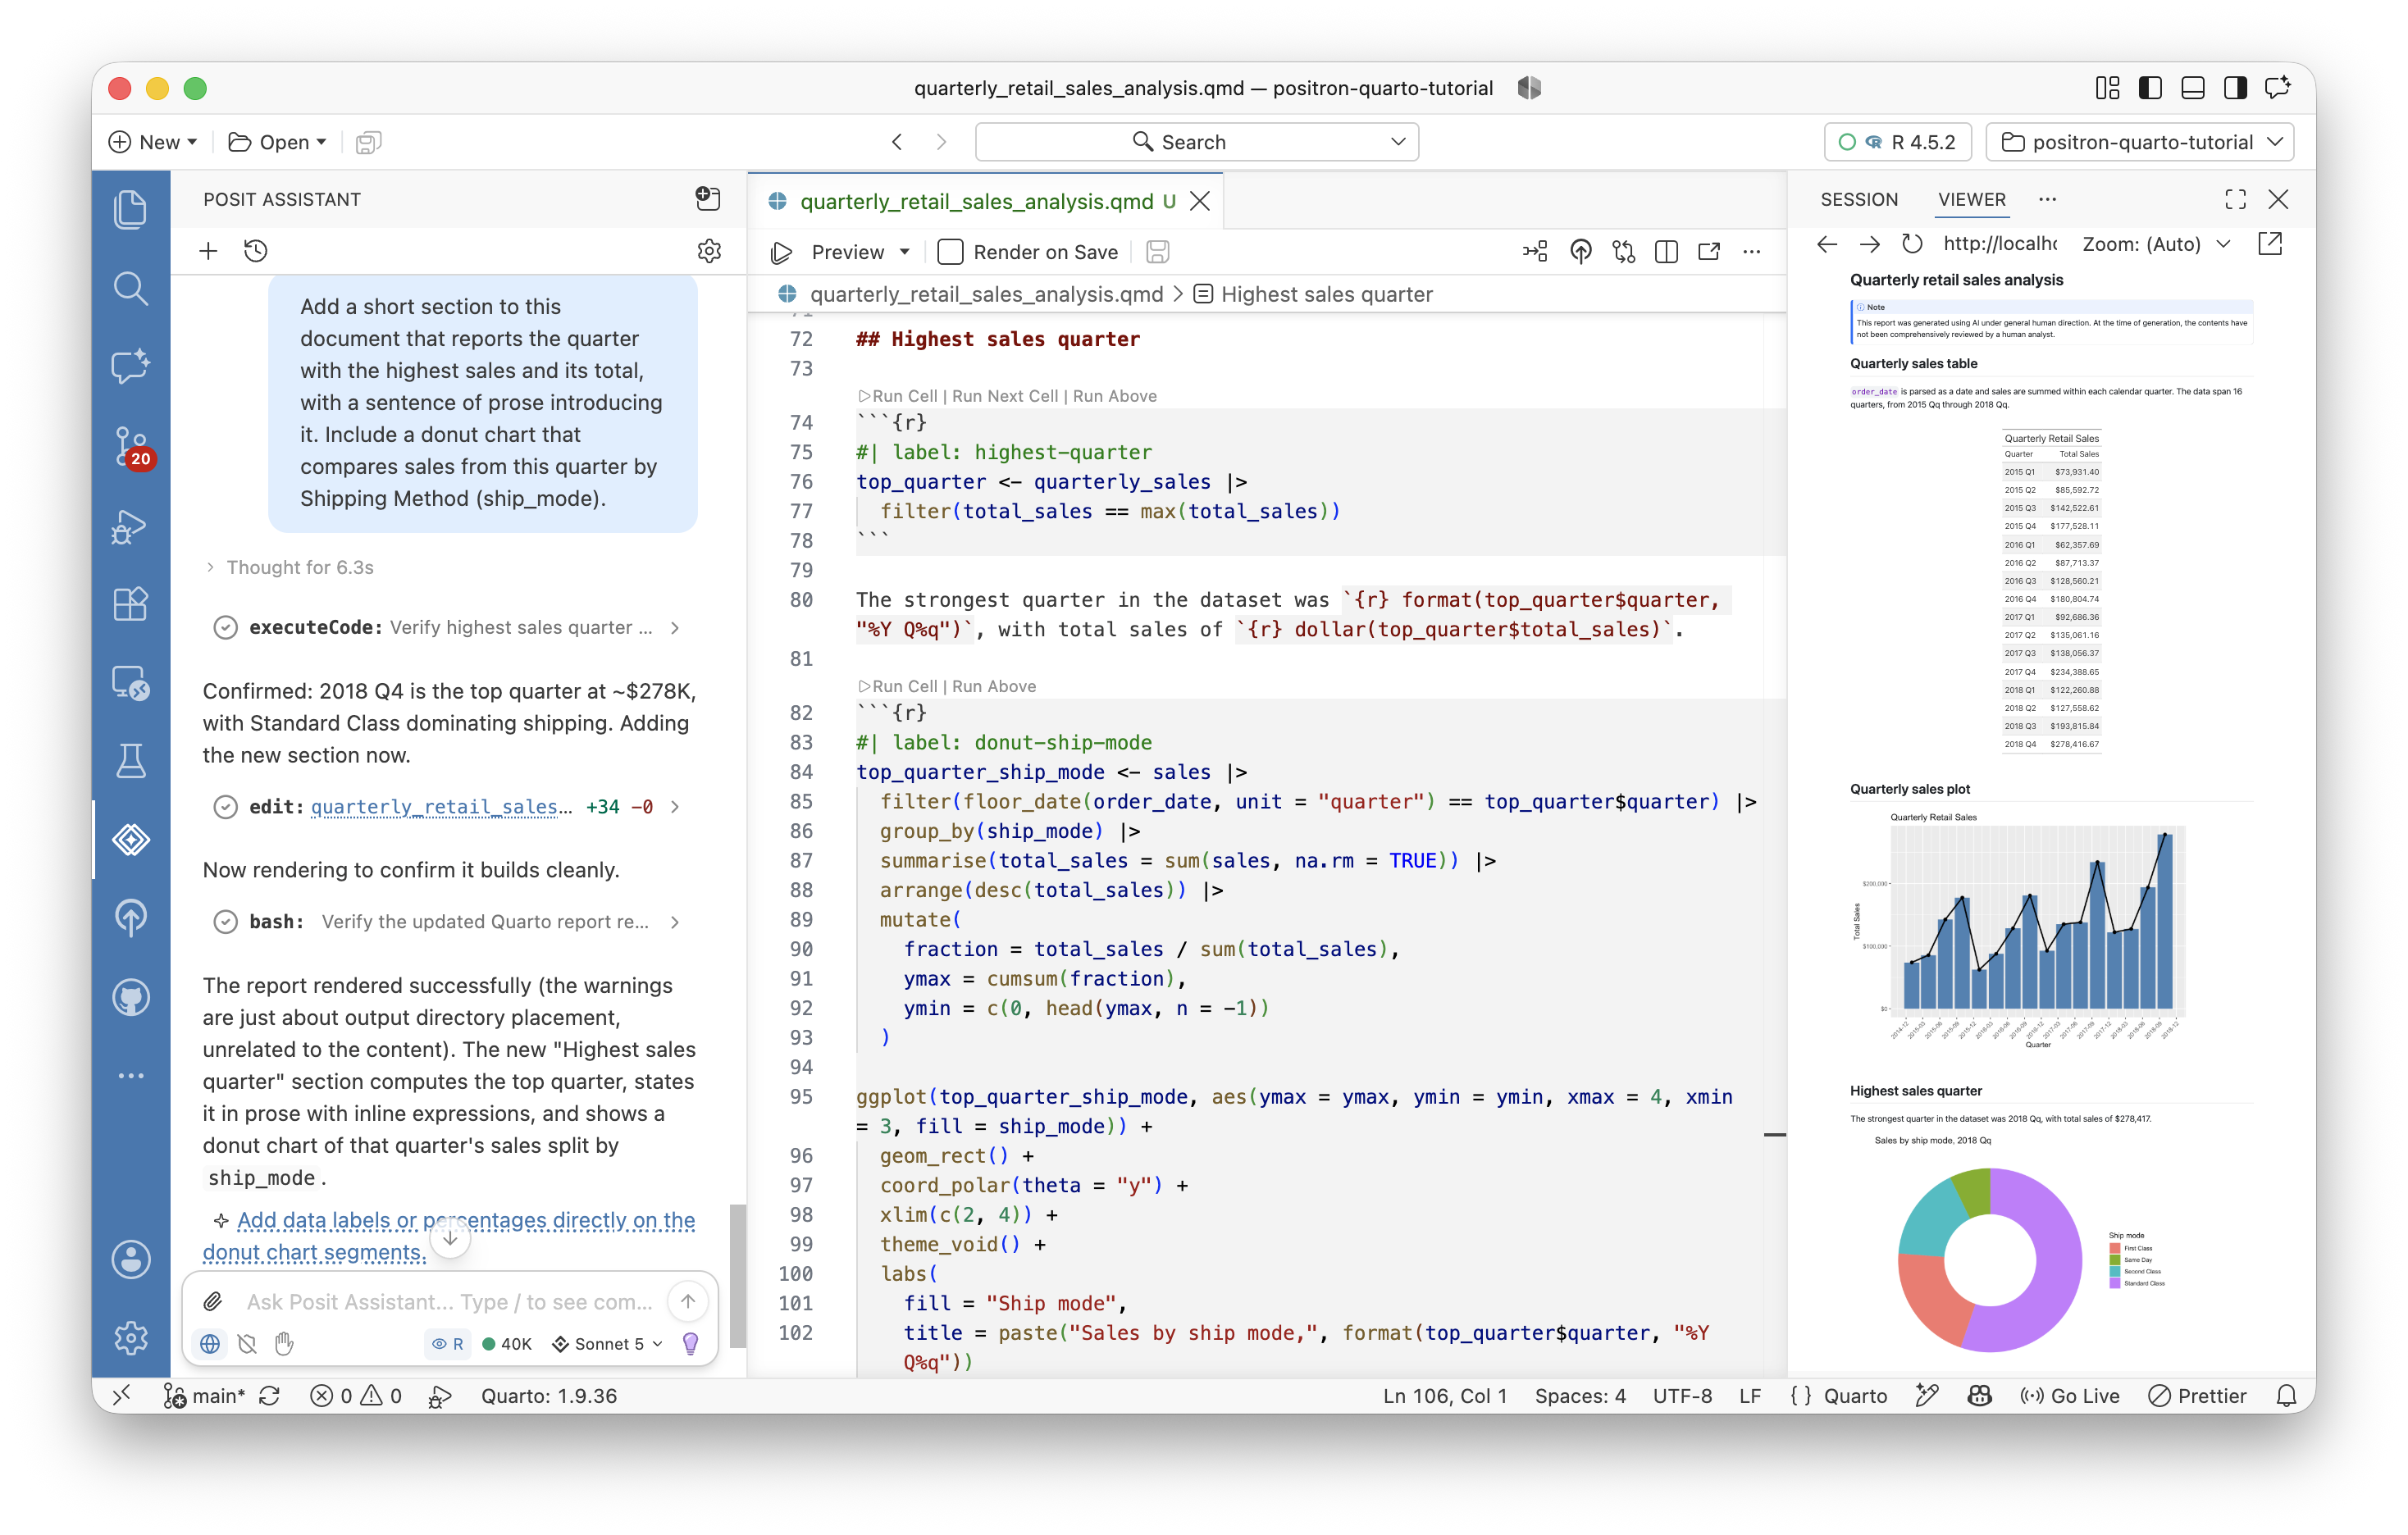
With the .qmd open, ask Posit Assistant:
Add a short section to this document that reports the quarter with the highest
sales and its total, with a sentence of prose introducing it. Include a donut
chart that compares sales from this quarter by Shipping Method (ship_mode).
Review the cell and prose Posit Assistant adds, then accept the change and click Preview to see it in the rendered report.
You will know it worked when a new section appears in the document naming the top quarter, and it renders in the preview.
Convert the report into a dashboard
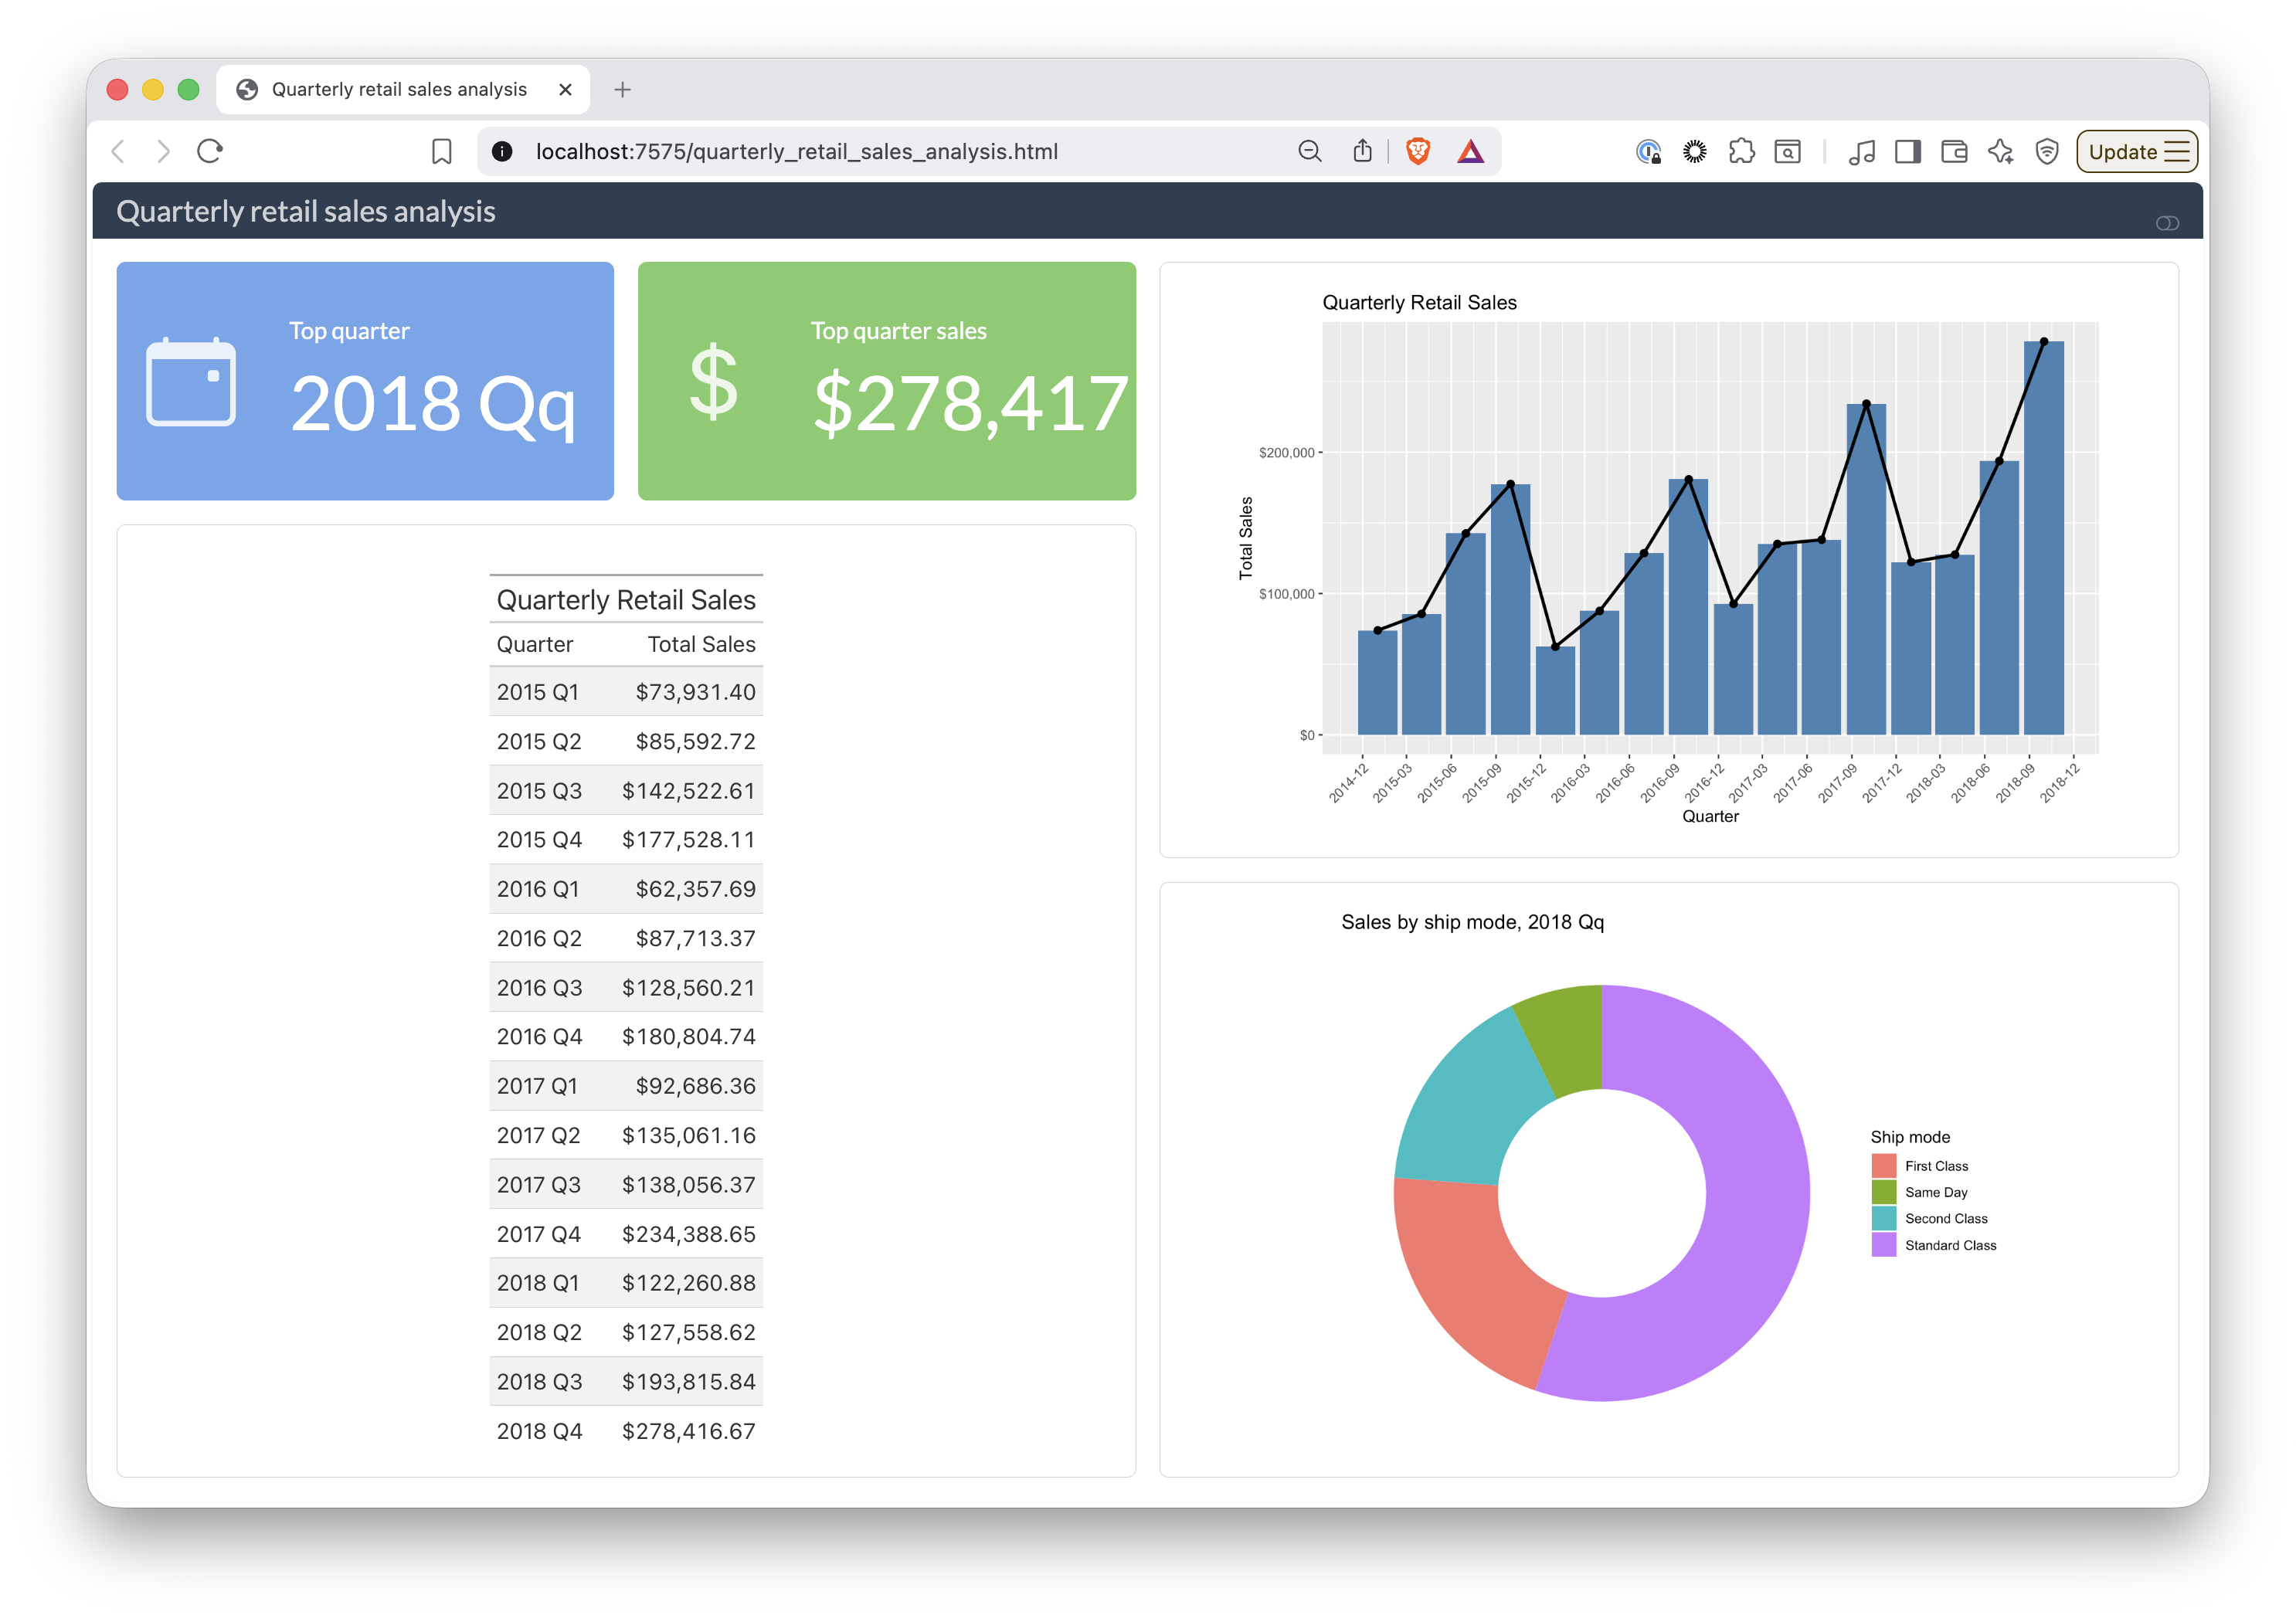
Quarto can render that same document as a dashboard, a layout of cards arranged in rows and columns, built for at-a-glance reading. Because the analysis is already Quarto, turning it into a dashboard changes how the content is laid out, not what it computes. Ask Posit Assistant to make that change.
With the .qmd open, ask Posit Assistant:
Convert this Quarto document into a dashboard with format: dashboard.
Remove all of the text and code, retaining just the cell outputs.
Use a two-column layout, and add a toggle to switch between light and dark mode.
When Posit Assistant has finished, press Preview to render the dashboard and preview it.
You will know it worked when the report renders as a two-column dashboard with a control to switch between light and dark themes. The dashboard appears as an HTML file saved in your project folder.
Publish your dashboard
Your dashboard is a single file you can share several ways, all from inside Positron:
- Commit and push it with the Git client to store it in a repository like the one you cloned. See Using Git in Positron.
- Publish it to Posit Connect or to Posit Connect Cloud with the Publisher extension, which deploys the rendered dashboard to a server your colleagues can open in a browser.
Wrap up
You took a spreadsheet from raw data to a published dashboard, with AI as a collaborator. Along the way, you:
- Explored
retail_sales.xlsxin the Data Explorer - Restored a project library from
renv.lock - Configured a language model provider for Posit Assistant
- Had Posit Assistant write the quarterly aggregation, a gt table, and a ggplot2 chart
- Exported the conversation with
/report, then fixed a cell, accepted a completion, and extended the analysis in the document - Reshaped the report into a publishable dashboard
Throughout, you made the choices and the LLM wrote the code: you reviewed each step, accepted or edited it, and kept a reproducible record you can rerun and share.
From here, dig deeper into the tools you used:
To keep going, explore the Guides for in-depth documentation on everything Positron can do.